CH11: Linux Forensics
Chapter Overview
Chapters 4 through 10 built an investigative toolkit grounded almost entirely in Windows. You learned to parse the Registry for user activity, extract browser artifacts from SQLite databases, capture volatile memory with specialized tools, trace email headers through SMTP infrastructure, and detect anti-forensic techniques designed to undermine every phase of the forensic lifecycle. That focus on Windows reflects reality: it dominates the corporate desktop and personal computing landscape, and the majority of endpoint investigations begin and end on a Windows machine.
This chapter confronts the other half of the equation. The infrastructure that powers the modern internet runs overwhelmingly on Linux. Web servers, cloud instances, containerized applications, database backends, network appliances, IoT devices, and NAS systems all rely on some variant of the Linux kernel. When an investigation leads to a compromised web server hosting a phishing kit, a cloud-based command-and-control node, an employee's Raspberry Pi plugged into the corporate network, or a suspect's Network Attached Storage device, the investigator must be able to navigate the system, locate its artifacts, and interpret the evidence it holds.
This chapter serves two purposes. First, it provides a grounded introduction to how Linux works, using your existing Windows knowledge as a bridge. You will learn the file system hierarchy, the permissions model, the ext4 file system and its inode structure, and the core commands that every investigator needs. Second, it introduces the forensic artifacts unique to Linux systems: log structures, user activity traces, configuration files, persistence mechanisms, and the purpose-built forensic distributions that analysts use to conduct examinations.
No prior Linux experience is assumed. By the end of this chapter, you will have the foundational knowledge needed to approach a Linux system with the same confidence you now bring to a Windows investigation.
Learning Objectives
By the end of this chapter, you will be able to:
- Explain why Linux forensics is an essential skill for digital forensic investigators and identify the types of systems and investigations where Linux evidence is commonly encountered.
- Navigate a Linux file system using command-line tools and map the Linux directory hierarchy to equivalent Windows structures.
- Interpret Linux timestamps (MAC times) and explain their forensic significance.
- Describe how the ext4 file system uses inodes to track files and explain how file deletion on ext4 differs from NTFS, including the implications for data recovery.
- Identify key forensic artifacts on Linux systems, including log files, user history, configuration files, scheduled tasks, and persistence mechanisms, and describe what each reveals to an investigator.
- Describe the purpose and capabilities of major Linux-based forensic distributions (SIFT, Kali, Tsurugi, CAINE) and explain when each is best suited for use.
11.1 Why Linux Forensics Matters
Where Linux Lives in Investigations
If you have used the internet today, you have interacted with Linux. The majority of the world's web servers run on Linux. Most cloud infrastructure, from Amazon Web Services EC2 instances to Microsoft Azure virtual machines to Google Cloud Platform compute nodes, defaults to Linux-based operating systems. The containers that power modern application deployment (Docker, Kubernetes) run on a Linux kernel. The routers, firewalls, and intrusion detection sensors that protect enterprise networks frequently run embedded Linux. Smart home devices, security cameras, point-of-sale terminals, and medical equipment all increasingly rely on Linux-based firmware.
For investigators, this means that Linux evidence appears in a wide range of case types:
- Server compromises: A company's Apache or Nginx web server is breached and used to host malware or a phishing kit. The access logs, error logs, and web shell artifacts all reside on a Linux file system.
- Cloud-based investigations: A threat actor spins up an AWS EC2 instance to serve as a command-and-control (C2) server for a botnet. The forensic image of that instance is a Linux disk.
- Insider threats: An employee connects a Raspberry Pi to the corporate network to exfiltrate data. The device runs Raspberry Pi OS, a Debian-based Linux distribution.
- IoT and embedded devices: A Network Attached Storage (NAS) device contains evidence relevant to an intellectual property theft case. Its operating system is a customized Linux build.
- Criminal infrastructure: Dark web marketplaces, bulletproof hosting providers, and ransomware C2 panels overwhelmingly operate on Linux servers.
The common thread is that even investigations that begin on a Windows endpoint frequently lead to Linux infrastructure. An investigator who can only work in Windows will eventually hit a wall.
The Linux Forensic Workstation
Linux is not only a source of evidence. It is also the platform on which many of the most powerful forensic tools are built and run. The Sleuth Kit, Autopsy, Volatility, log2timeline (Plaso), and bulk_extractor all have deep roots in the Linux ecosystem. The SANS SIFT Workstation, one of the most widely used forensic environments in the field, is an Ubuntu-based Linux distribution.
This creates a dual relationship that is unique to Linux forensics: the same operating system you are learning to examine is the operating system you will use to examine it. The command-line skills you develop in this chapter are directly transferable to your forensic workstation workflow.
Tip
You can find more information and download the .ova virtual machine image of SANS SIFT Workstation at https://www.sans.org/tools/sift-workstation -- I recommend downloading VMware Workstation Pro to run the VM.
Windows vs. Linux: A Conceptual Bridge
Many of the concepts you learned in previous chapters have direct counterparts in Linux. The underlying principles of how an operating system manages files, users, processes, and logs are consistent across platforms. What changes is the implementation and the location. The following table maps the Windows concepts you already know to their Linux equivalents.
| Windows Concept | Linux Equivalent | Key Difference |
|---|---|---|
| Registry (HKLM, HKCU) | Configuration files in /etc/ and ~/. | Linux stores settings in human-readable text files, not a binary database |
| Event Viewer / .evtx logs | syslog, journald (/var/log/) | Linux logs are primarily text-based (or queryable via journalctl) |
| Task Manager | ps, top, htop |
Linux process management is command-line driven |
| File Explorer | Terminal (ls, cd, find) |
GUI file managers exist, but investigators work in the terminal |
| PowerShell / CMD | Bash shell | Bash is the default shell on most Linux distributions |
| NTFS | ext4 (and others: XFS, Btrfs) | ext4 uses inodes instead of MFT entries |
| Windows Services | systemd units / daemons | Services are defined in unit files, not the Registry |
| Recycle Bin | No equivalent (CLI rm is permanent) |
Desktop environments have a Trash folder, but CLI deletions are immediate |
| MFT (Master File Table) | Inode table | Both track file metadata; deletion behavior differs significantly |
11.2 Linux Fundamentals for Investigators
The Linux Architecture
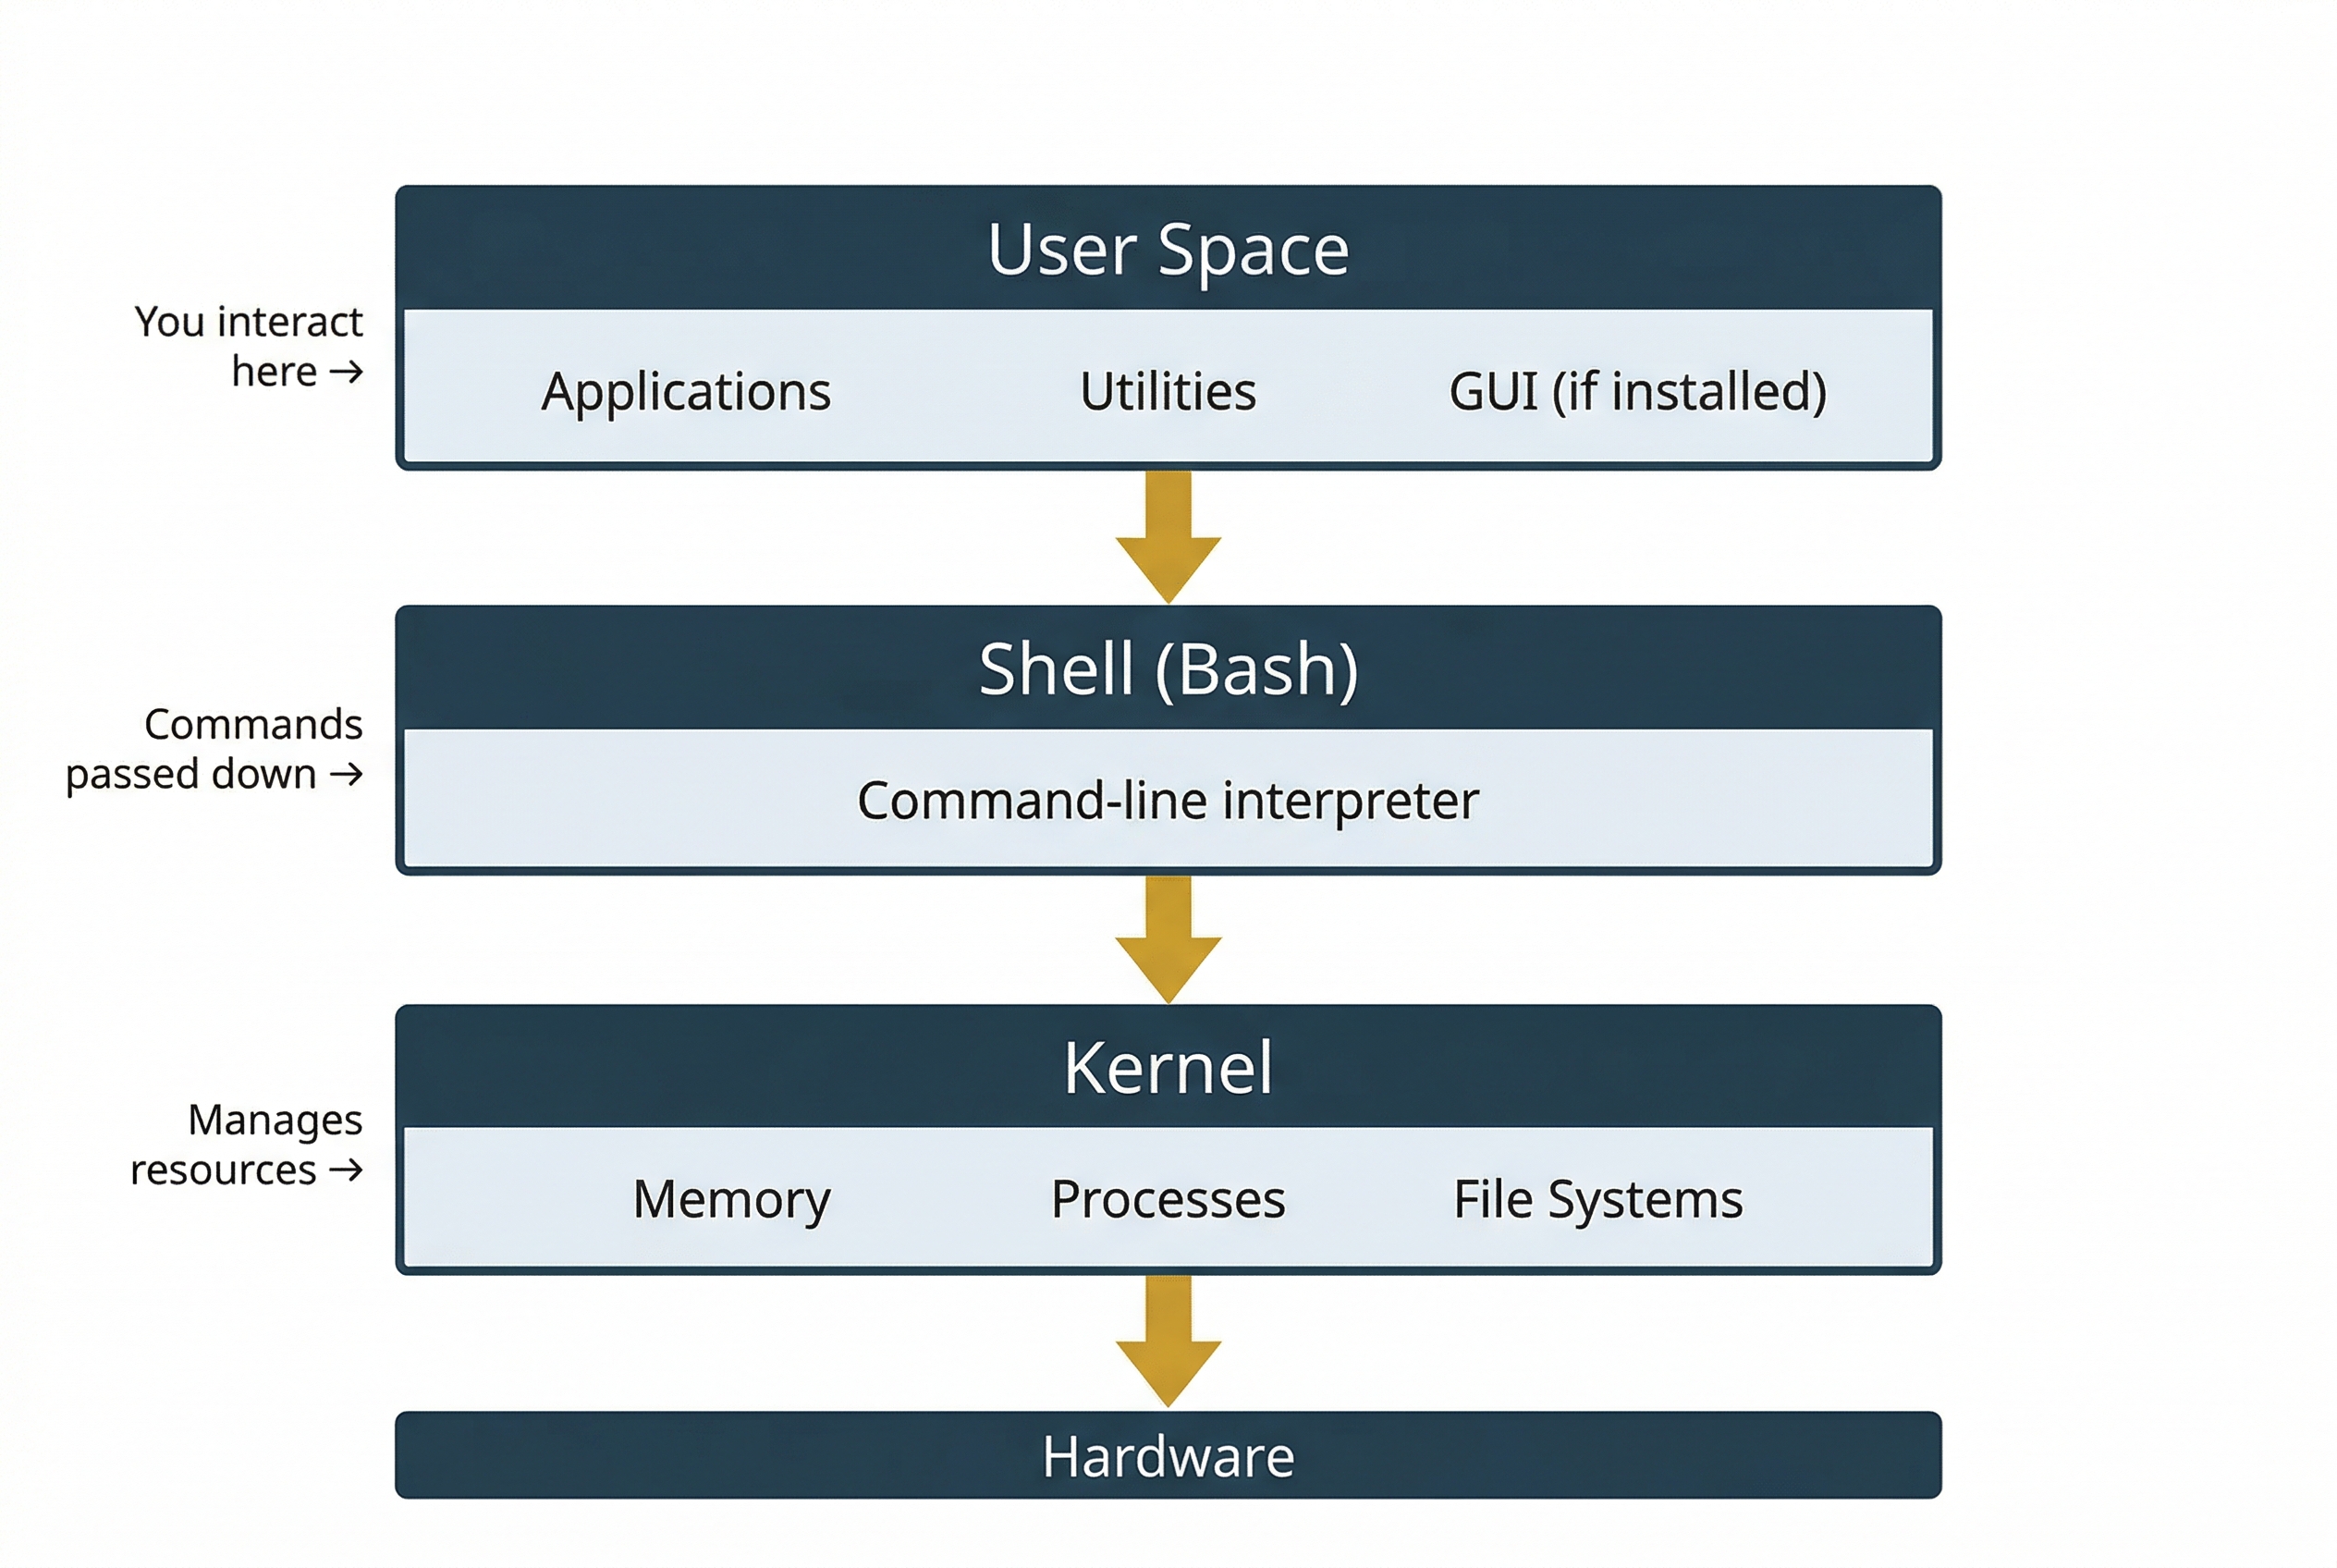
At the highest level, a Linux system has three layers. The kernel is the core of the operating system. It manages hardware, memory, processes, and file systems. You do not interact with the kernel directly. Instead, you interact with the shell, which is a command-line interpreter that accepts your typed commands, passes them to the kernel for execution, and returns the results. The default shell on most Linux distributions is Bash (Bourne Again Shell). Above the shell sits the user space, which includes all the applications, utilities, and graphical interfaces (if installed) that you work with day to day.
A Linux distribution (often shortened to "distro") is a complete operating system built around the Linux kernel. Different organizations package the kernel with different sets of software, desktop environments, package managers, and default configurations. The result is a large ecosystem of distributions, each tailored to specific use cases. The most common distributions you will encounter in forensic work include:
- Ubuntu / Debian: Widely used for servers and workstations. Ubuntu is the base for the SANS SIFT forensic distribution. Uses the
aptpackage manager. - CentOS / Red Hat Enterprise Linux (RHEL) / Rocky Linux: Common in enterprise server environments. Uses the
yumordnfpackage manager. - Fedora: A community-driven distribution often used as a development platform. Also uses
dnf.
The distribution matters to investigators for two reasons. First, log file names and locations can vary between distributions (for example, Debian-based systems use /var/log/auth.log while Red Hat-based systems use /var/log/secure). Second, the package manager logs (/var/log/dpkg.log on Debian, /var/log/yum.log on Red Hat) record software installation history, which is a forensic artifact in its own right.
The File System Hierarchy
One of the most fundamental differences between Windows and Linux is how the file system is organized. Windows uses drive letters (C:\, D:) as the top-level entry points. Linux has a single, unified directory tree that begins at the root directory, represented by a forward slash (/). Every file, directory, device, and even running process is accessible somewhere within this tree.
Linux follows the Filesystem Hierarchy Standard (FHS), which defines a common directory layout across distributions. As an investigator, knowing this layout tells you exactly where to look for specific types of evidence.
| Directory | Purpose | Forensic Relevance |
|---|---|---|
/ |
Root of the entire file system | Starting point for all examination |
/home |
User home directories (e.g., /home/jsmith) | User documents, bash history, SSH keys, browser profiles, desktop files |
/root |
Home directory for the root (admin) user | Same as /home but for the superuser account |
/etc |
System-wide configuration files | User accounts (/etc/passwd), network config, service settings, sudoers |
/var |
Variable data: logs, caches, spools | Primary log location (/var/log/), web server data, mail spools |
/tmp |
Temporary files (often cleared on reboot) | Attacker staging area, malware drop zone, exploit artifacts |
/dev |
Device files (hard drives, terminals, etc.) | Disk device references for imaging (e.g., /dev/sda) |
/proc |
Virtual filesystem exposing kernel/process data | Running processes, network connections, system info (live systems only) |
/mnt, /media |
Mount points for external/removable media | USB drives, mounted disk images, network shares |
/opt |
Optional or third-party software | Non-standard application installations |
/usr |
User programs, libraries, documentation | Installed application binaries and shared libraries |
/bin, /sbin |
Essential system binaries | Core commands (ls, cp, mount); /sbin holds admin-only tools |
A guiding principle in Linux is that everything is a file. Directories are files. Hardware devices are represented as files in /dev. Running processes are exposed as files in /proc. This unified abstraction means that investigators can use the same file-reading tools to inspect a text configuration, a raw disk device, or process memory.
The ext4 File System and Inodes
The ext4 (Fourth Extended Filesystem) is the default file system on the majority of modern Linux distributions. It fills the same role that NTFS fills on Windows: it is the structure responsible for organizing data on a storage volume, tracking which blocks belong to which files, and maintaining the metadata that describes every file on disk.
In Chapter 4, you learned that NTFS uses the Master File Table (MFT) as its central metadata structure. Every file and directory on an NTFS volume has a corresponding MFT entry that records the file's name, size, timestamps, permissions, and the cluster runs that point to the file's data on disk.
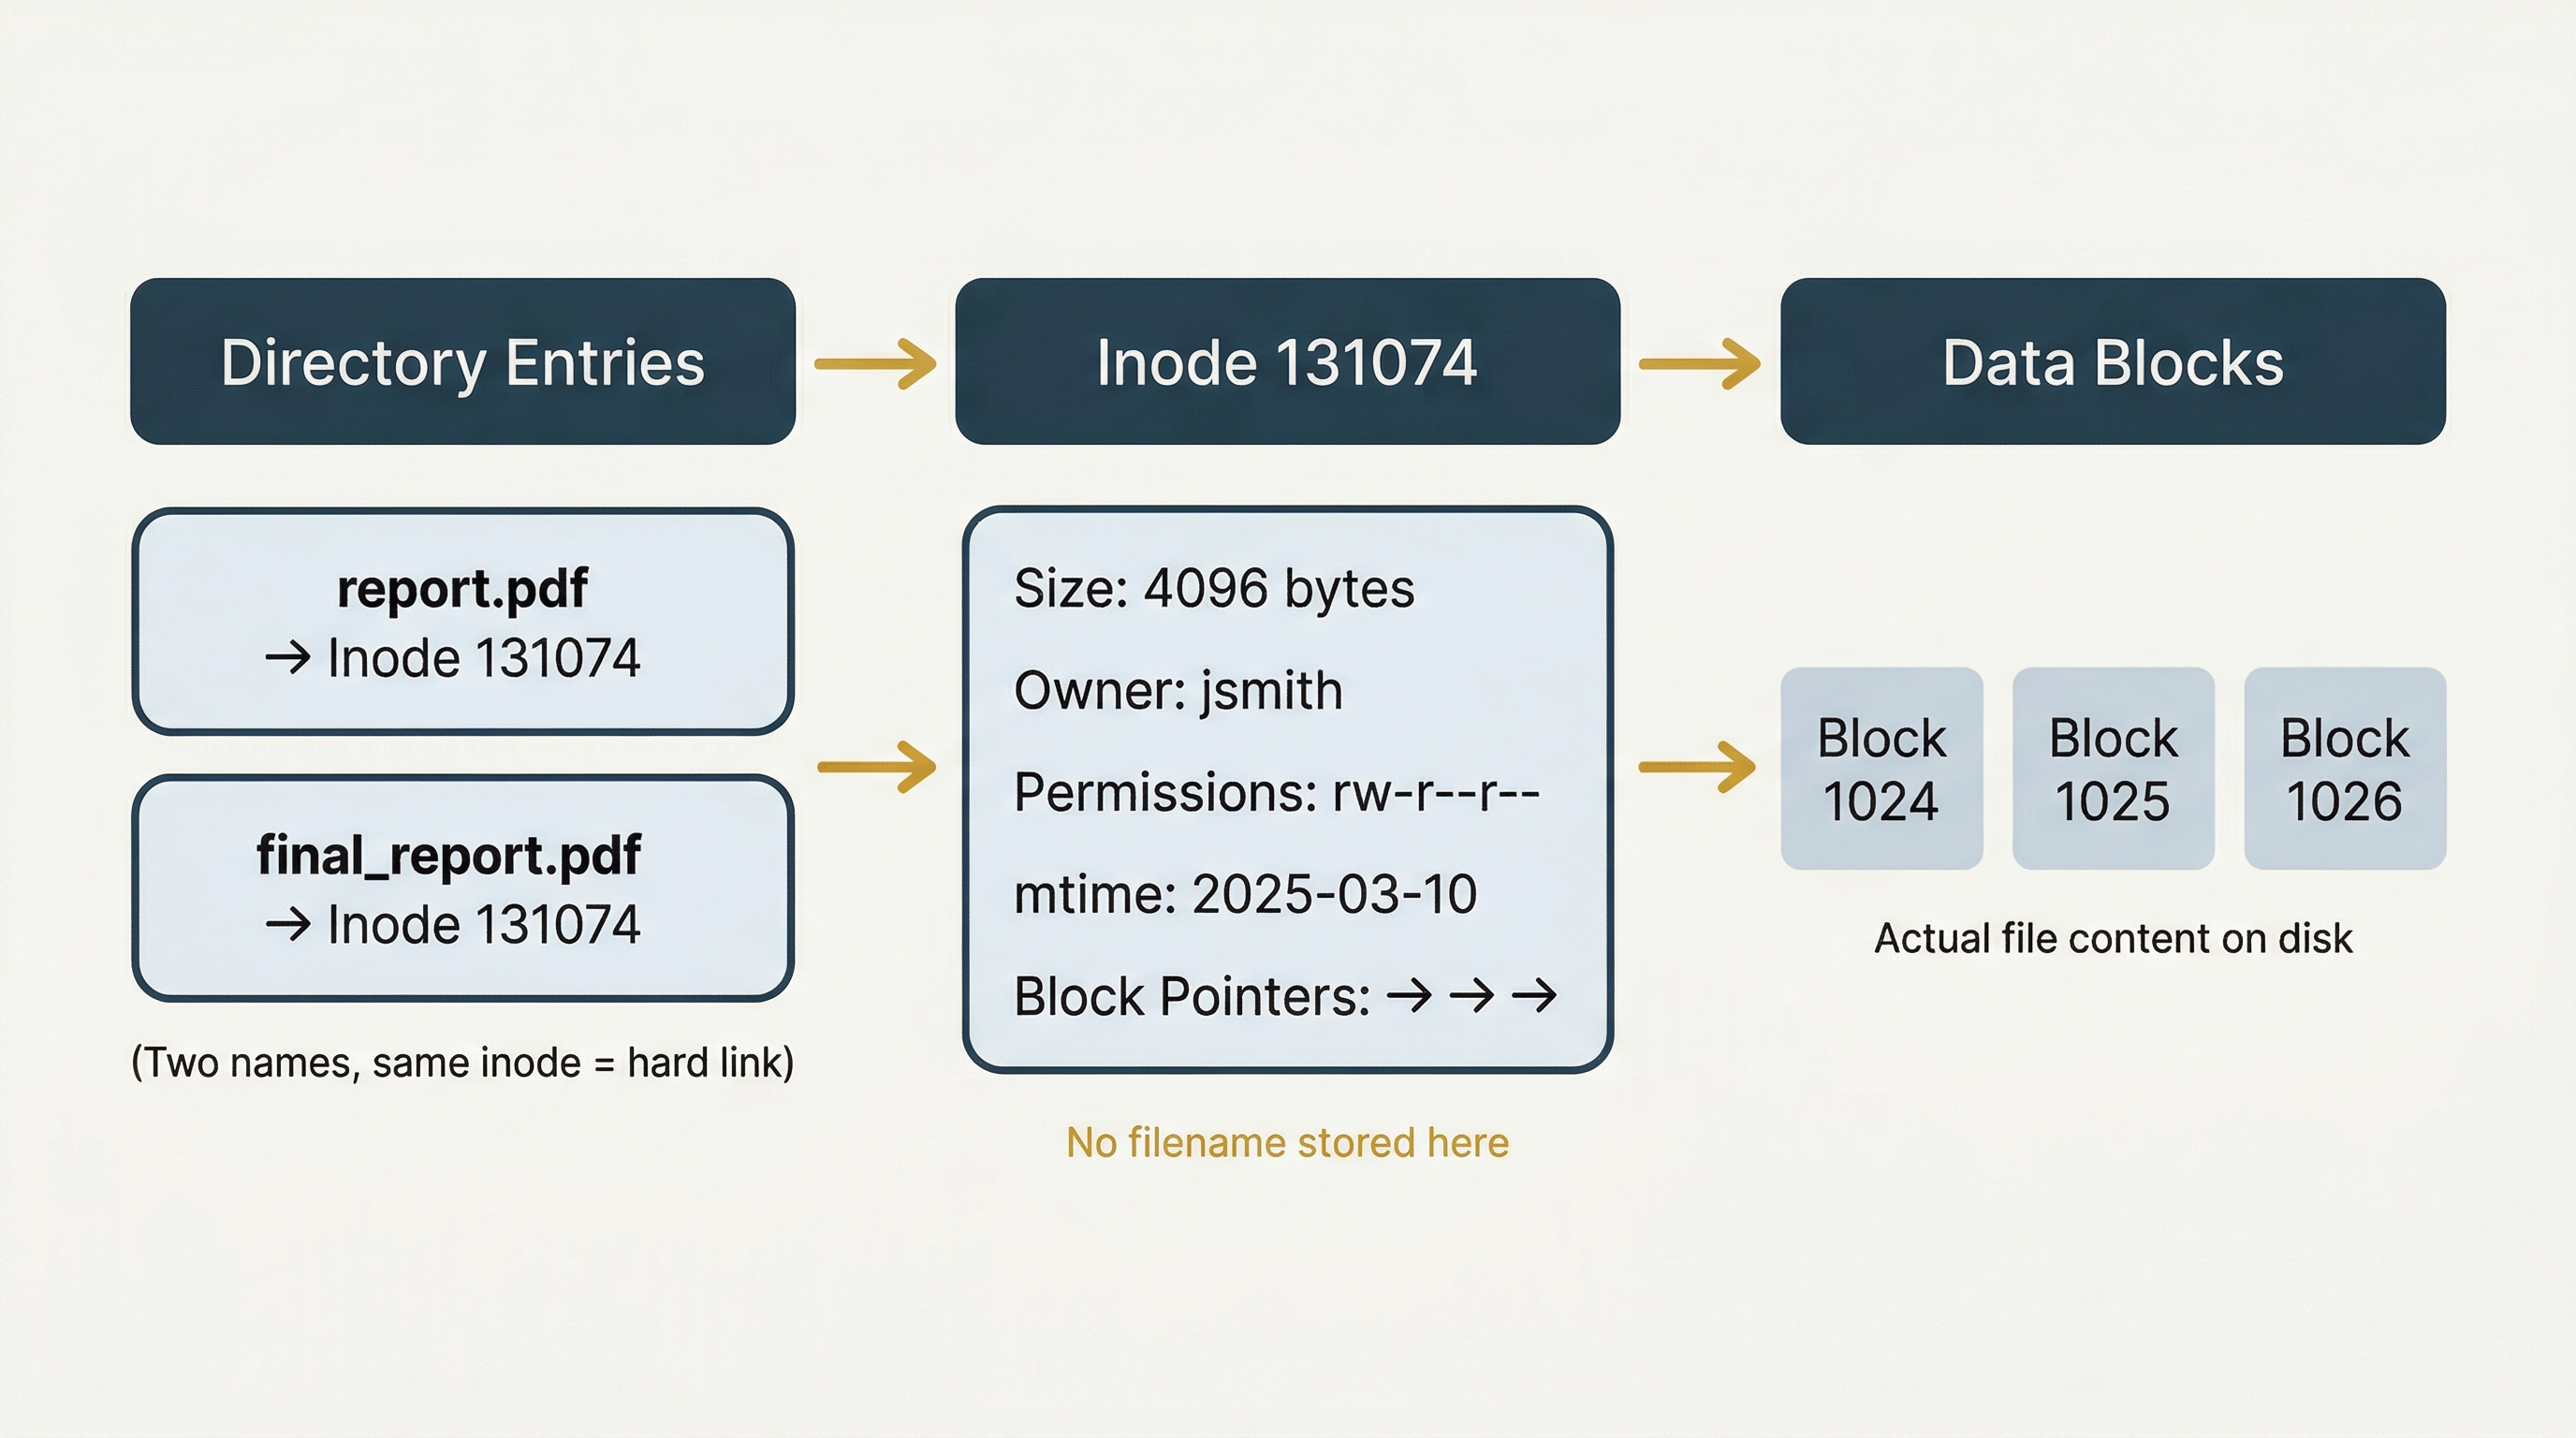
Ext4 uses a different but conceptually parallel structure called an inode (short for "index node"). Every file and directory on an ext4 volume has an inode, and each inode stores the following metadata:
- File size
- Ownership (User ID and Group ID)
- Permissions (read, write, execute for owner, group, and others)
- Timestamps (access time, modification time, change time)
- Pointers to the data blocks where the file's actual content is stored on disk
- Link count (how many directory entries reference this inode)
There is one critical distinction between an inode and an MFT entry that catches many new investigators off guard: the inode does not store the filename. Filenames are stored in directory entries, which are separate structures that map a human-readable name to an inode number. This separation means that a single file can have multiple names (called hard links) that all point to the same inode and the same underlying data.
Each inode has a unique number within the file system. You can view a file's inode number using ls -i and view the full inode metadata using the stat command.
How ext4 Handles File Deletion
Understanding how ext4 handles deletion is essential for forensic recovery work, and this is where the comparison to NTFS becomes particularly important.
When you delete a file on an NTFS volume (even bypassing the Recycle Bin), the MFT entry is marked as available for reuse, and the clusters it occupied are marked as free. However, the MFT entry itself often retains the cluster run information, the pointers that tell you exactly where the file's data was stored on disk. This is why NTFS deleted file recovery is relatively straightforward in many cases: the roadmap back to the data frequently survives.
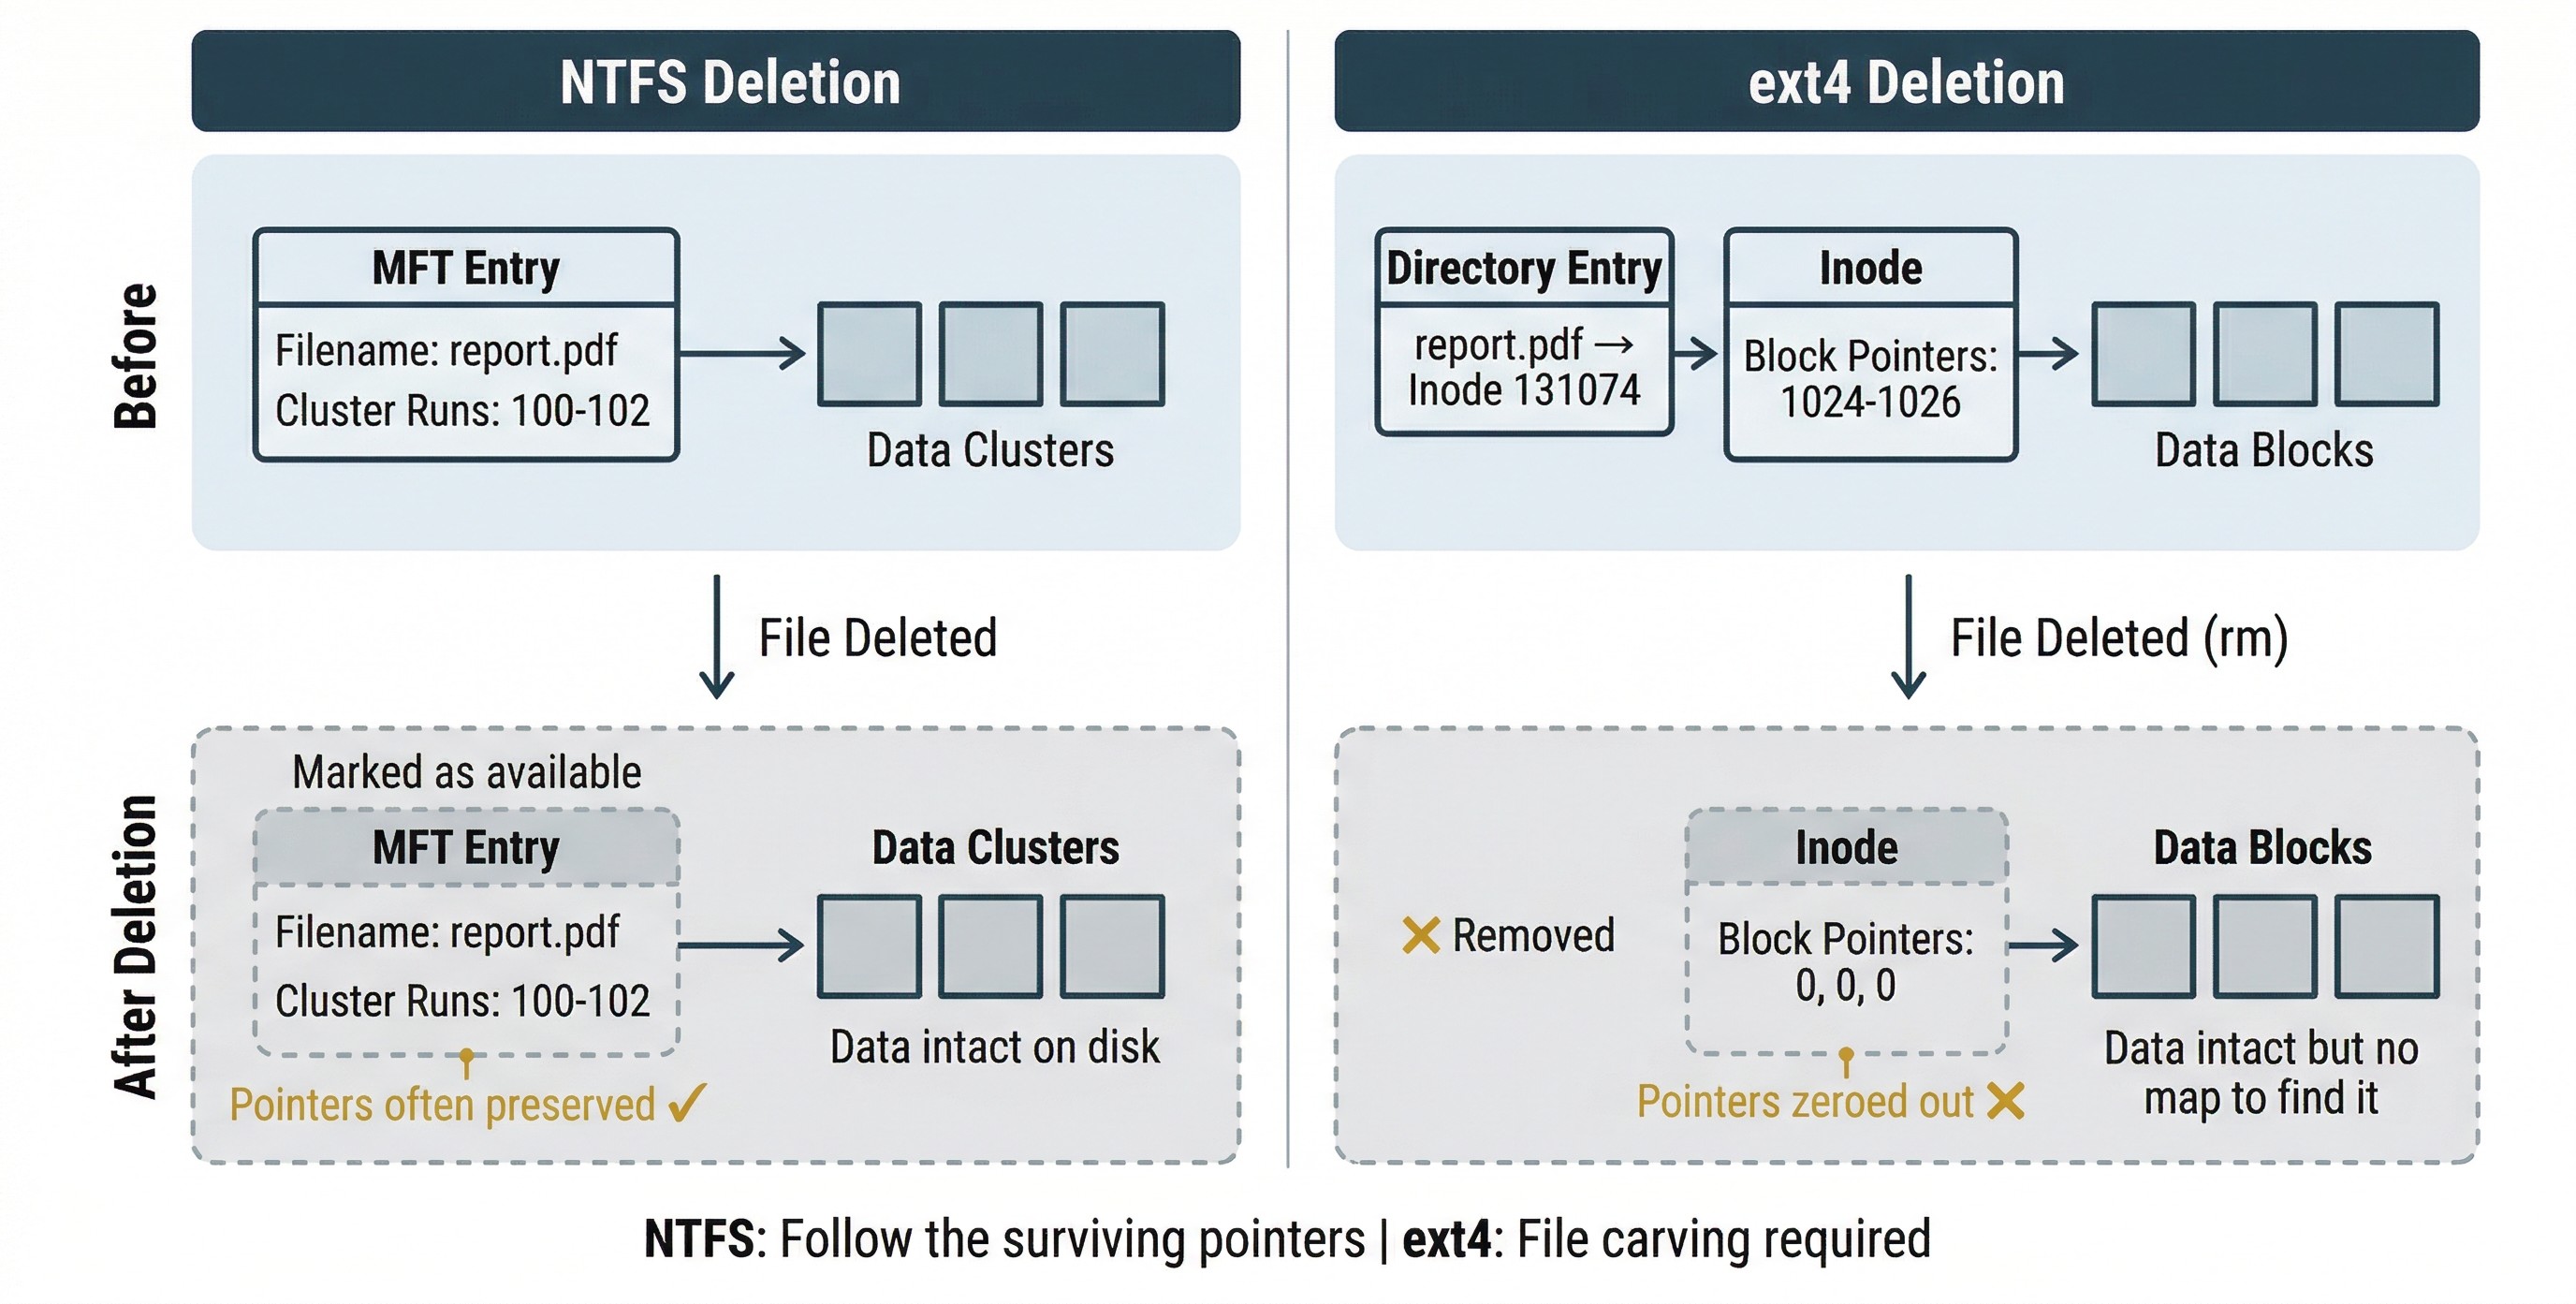
Ext4 behaves differently. When a file is deleted using rm:
- The directory entry linking the filename to the inode is removed.
- The inode is marked as free, and its data block pointers are zeroed out.
- The actual data blocks on disk are NOT overwritten. They remain intact until the file system reuses that space for new data.
Step 2 is the critical difference. On NTFS, the pointers from the MFT entry to the data clusters often survive deletion. On ext4, the pointers from the inode to the data blocks are actively cleared. The data is still on disk, but the file system no longer provides a map to find it.
Warning
Unlike NTFS, ext4 zeroes out the block pointers in the inode when a file is deleted. This means traditional metadata-based recovery (following the inode's pointers back to the data) is significantly harder on Linux than on Windows. Investigators working with ext4 evidence should plan for file carving and journal analysis as primary recovery strategies rather than relying on inode-based reconstruction.
The ext4 Journal
Ext4 maintains a journal that logs metadata changes before committing them to the main file system structures. This is conceptually similar to the NTFS $LogFile you encountered in Chapter 4. The journal exists to protect file system integrity: if the system crashes mid-write, the journal allows ext4 to replay or roll back incomplete operations and return to a consistent state.
For investigators, the journal has a secondary value. Because it records metadata changes, the journal can sometimes contain remnants of deleted file metadata, including block pointers that have already been zeroed in the inode itself. Journal analysis is not guaranteed to recover deleted file information, but it provides a partial recovery path that should always be explored.
Recovery Tools and Strategies
Given the challenges of ext4 deletion, investigators rely on several approaches:
- File carving (using tools like Foremost, Scalpel, or PhotoRec, which you encountered in Chapter 4) remains highly effective on ext4. Carving operates on raw data blocks and searches for file signatures (magic bytes) regardless of file system metadata. Because the data blocks survive deletion, carving can recover files even when the inode pointers are gone.
- Journal analysis using tools such as
extundeleteorext4magiccan attempt to reconstruct deleted file metadata from journal entries. - The Sleuth Kit (
fls,icat,ifind) can enumerate deleted directory entries and, in some cases, recover file content when the data blocks have not yet been reused. - Time is the critical variable. The longer a system runs after a file is deleted, the more likely its data blocks are reused by new files. Rapid acquisition is even more important on ext4 than on NTFS.
| Feature | NTFS | ext4 |
|---|---|---|
| Central metadata structure | MFT (Master File Table) | Inode table |
| Metadata per file | MFT entry | Inode |
| Filename storage | Inside the MFT entry | In directory entries (separate from inode) |
| Data location pointers | Cluster runs in MFT entry | Block pointers in inode |
| Pointers after deletion | Often preserved in MFT entry | Zeroed out in inode |
| Transaction log | $LogFile | ext4 journal |
| Deleted file recovery | Metadata-based recovery often viable | File carving and journal analysis preferred |
| Key recovery tools | Autopsy, FTK, Recuva | Foremost, Scalpel, extundelete, Sleuth Kit |
Timestamps in Linux
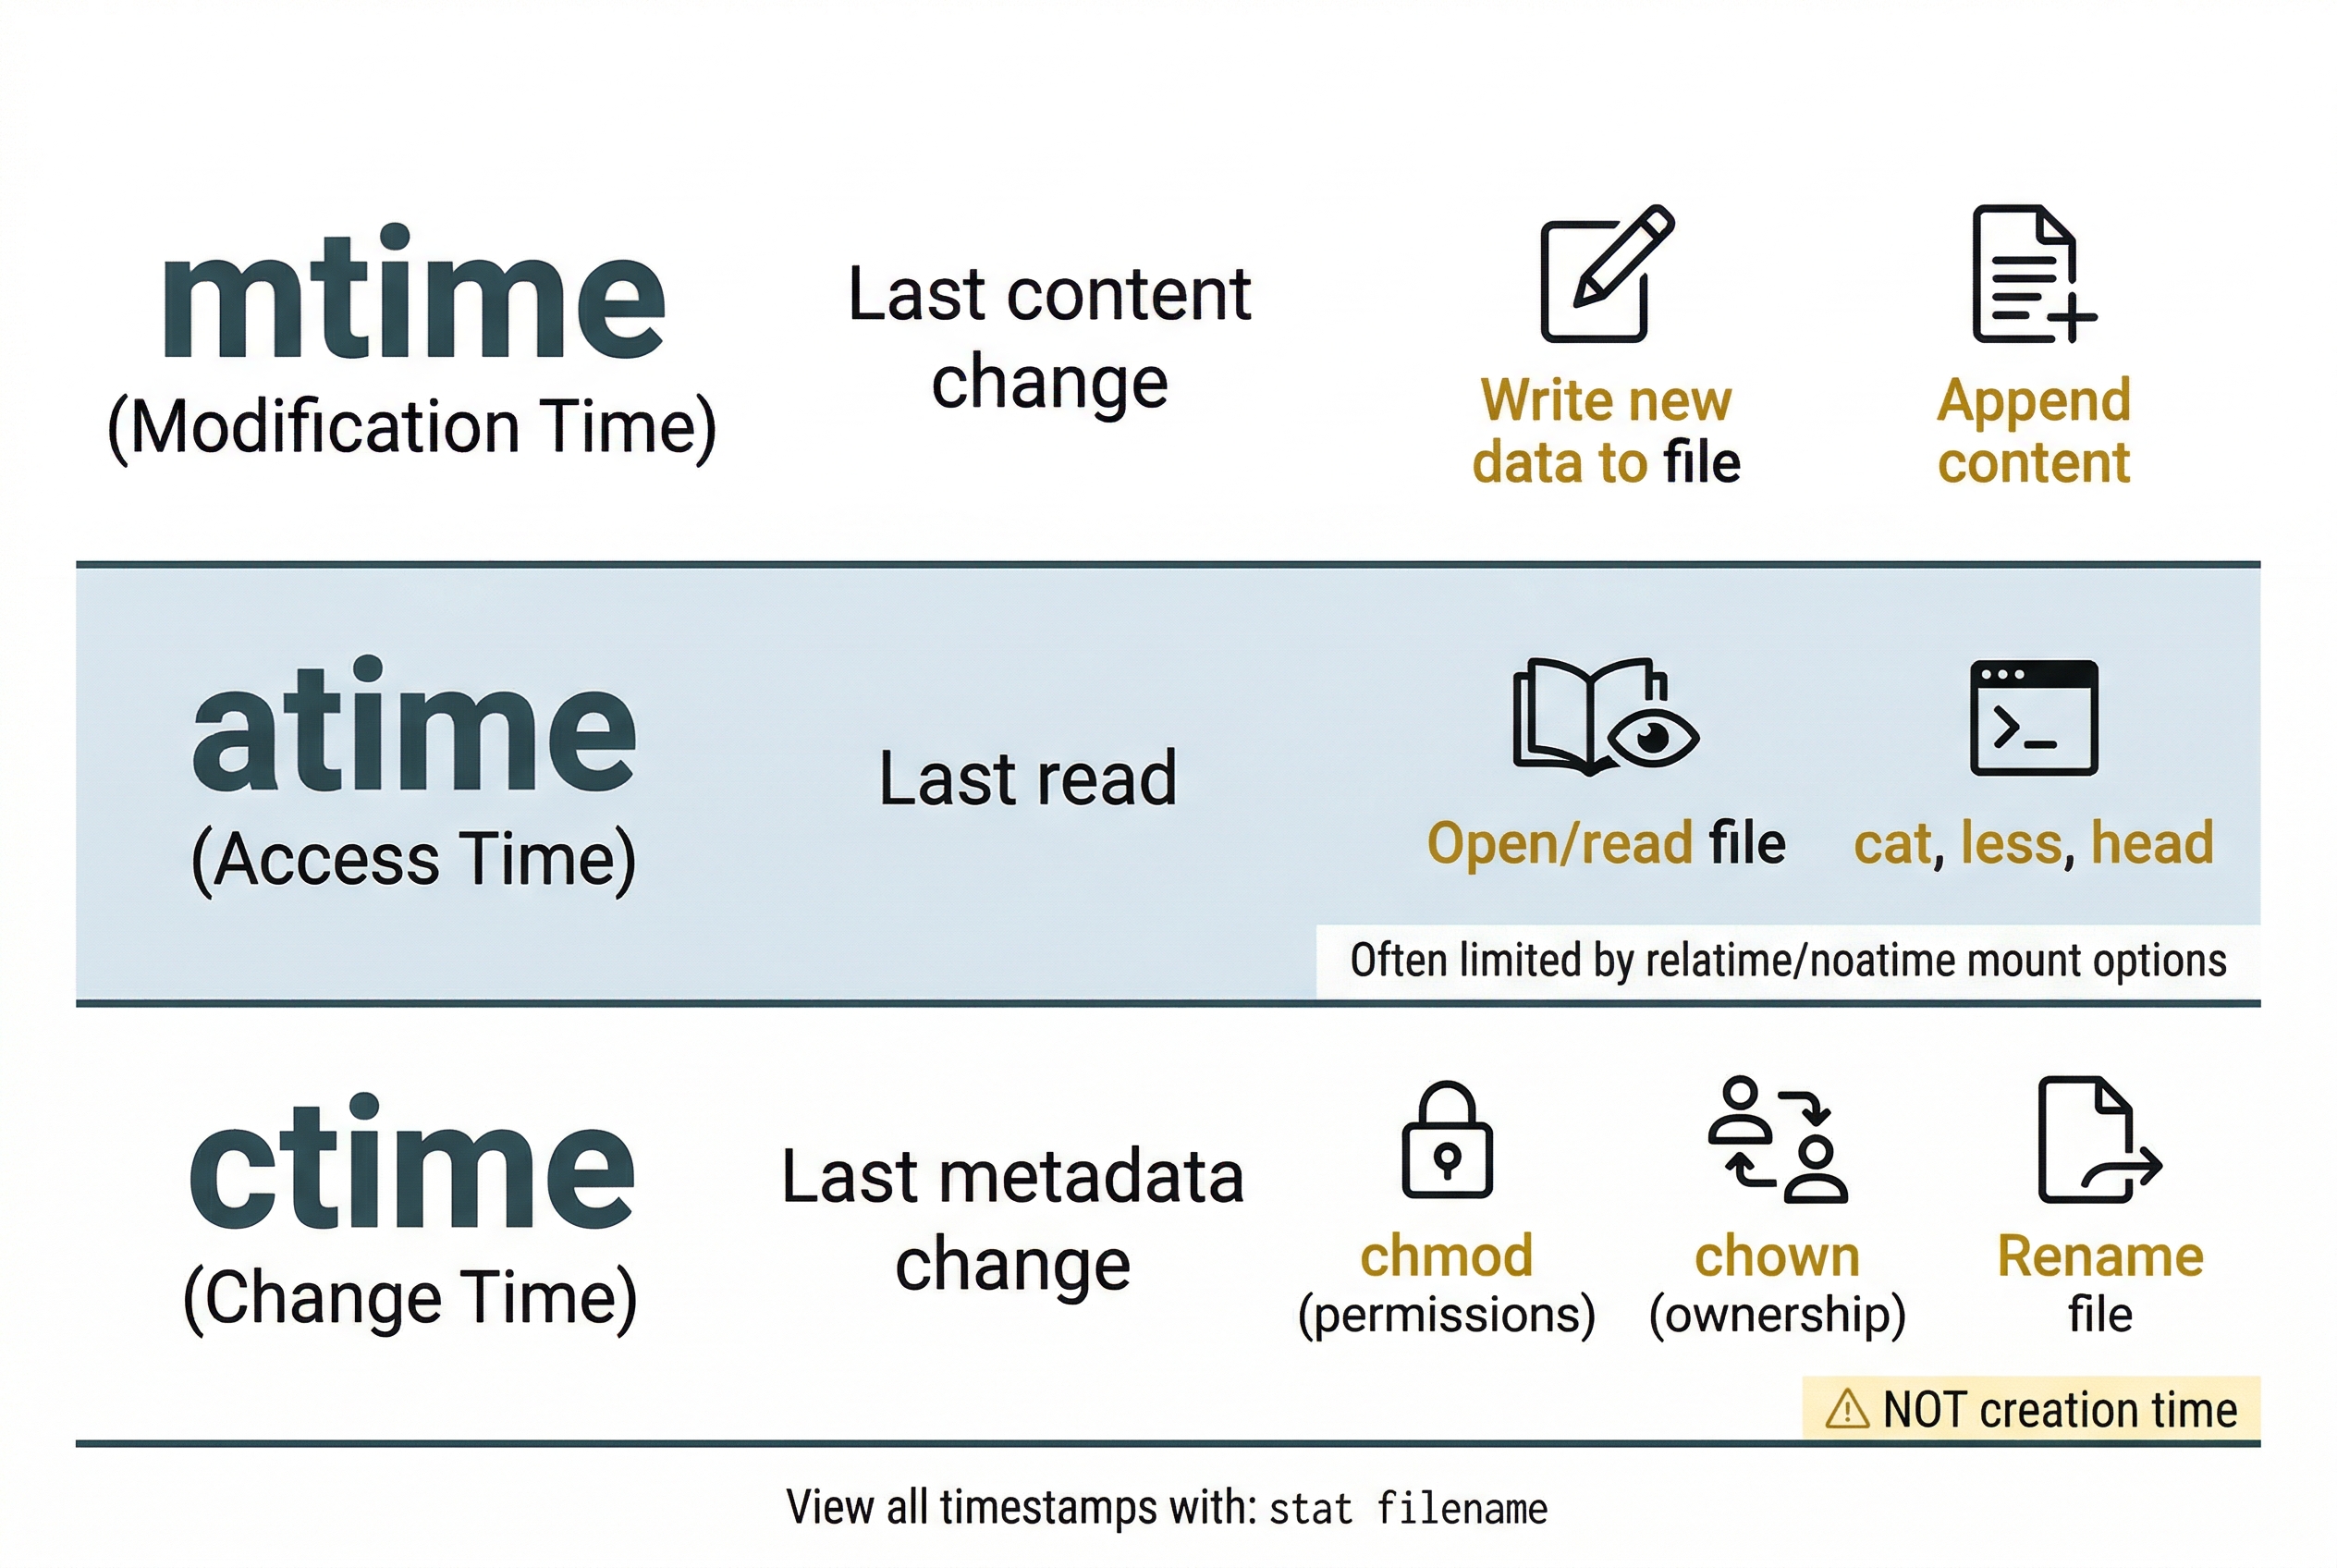
Linux tracks three timestamps for every file, commonly referred to as MAC times (not to be confused with Apple Mac computers):
- mtime (Modification time): The last time the file's content was changed. Writing new data to the file updates mtime.
- atime (Access time): The last time the file was read. Opening or reading a file updates atime (though many modern systems mount with
relatimeornoatimeto reduce disk writes, which limits atime updates). - ctime (Change time): The last time the file's metadata was changed. This includes permission changes, ownership changes, and renaming. Critically, ctime is not a "creation time." Linux ext4 traditionally did not record a creation time at all, although ext4 does support a
crtime(creation time) field that is accessible throughstaton newer systems.
The stat command displays all timestamps for a file:
$ stat report.pdf
  File: report.pdf
  Size: 4096       Blocks: 8          IO Block: 4096   regular file
  Device: 802h/2050d   Inode: 131074     Links: 1
  Access: (0644/-rw-r--r--)  Uid: ( 1000/ jsmith)  Gid: ( 1000/ analysts)
  Access: 2025-03-15 09:22:14.000000000 -0400
  Modify: 2025-03-10 14:35:02.000000000 -0400
  Change: 2025-03-10 14:35:02.000000000 -0400
   Birth: 2025-03-01 08:15:30.000000000 -0400
Compare this to the Windows timestamp model from Chapter 4. NTFS stores timestamps in the $STANDARD_INFORMATION and $FILE_NAME attributes of each MFT entry. The principle is the same (timestamps track when a file was created, accessed, modified, and when its metadata changed), but the specific names and behaviors differ. In particular, the ctime/mtime distinction on Linux is a frequent source of confusion: changing a file's permissions updates ctime but not mtime, because the content did not change, only the metadata.
11.3 Essential Linux Commands for Forensic Investigators
The Linux command line is the primary interface for forensic work. Unlike Windows, where GUI tools dominate the investigator's workflow, Linux forensic analysis is built around chaining small, purpose-built commands together to search, filter, and analyze data. This section covers the commands you will use most frequently, organized by function.
Navigation and File Inspection
These commands let you move through the file system, examine files, and inspect metadata.
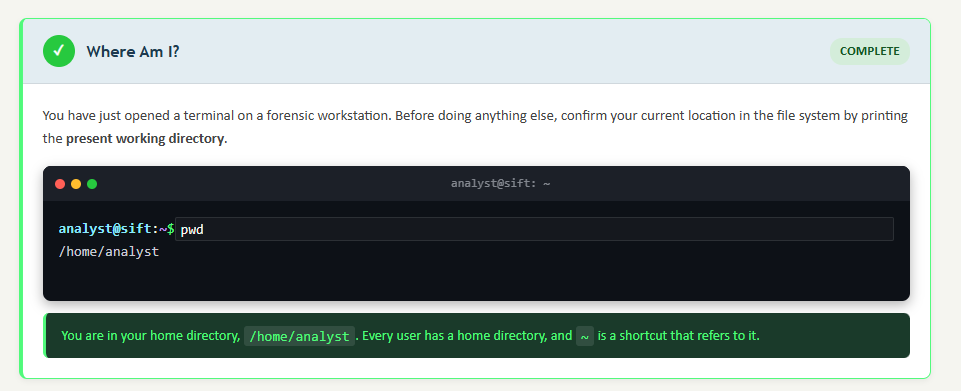
pwd (print working directory) displays your current location in the file system. On a mounted forensic image, this helps you confirm that you are examining the correct directory.
ls (list) displays the contents of a directory. The flags you will use most often include -l (long format showing permissions, owner, size, and timestamps), -a (show hidden files, which start with a dot), and -h (human-readable file sizes). In practice, ls -la is the investigator's default command upon entering any directory.
cd (change directory) moves you between directories. Use cd /var/log/ to navigate to the log directory, cd ~ to return to your home directory, and cd .. to move up one level.
cat displays the entire contents of a file. Useful for short files like configuration files. For large files (like multi-gigabyte logs), use less instead, which provides a paginated, scrollable view. head and tail display the first or last N lines of a file, respectively. tail -n 100 /var/log/auth.log is a quick way to check the most recent authentication events.
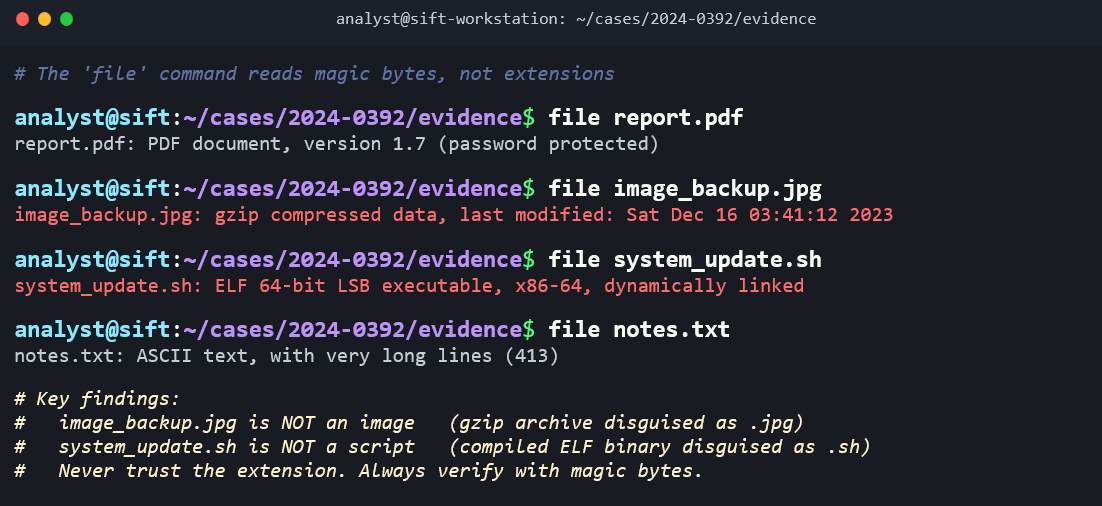
file identifies a file's type by examining its magic bytes (the file header), not its extension. This is the same concept you encountered in Chapter 10 when detecting file extension mismatch as an anti-forensic technique. Running file suspicious.dat might return suspicious.dat: PHP script, ASCII text, revealing that someone renamed a PHP web shell with a .dat extension.
stat displays detailed file metadata including all three timestamps (atime, mtime, ctime), inode number, permissions, and ownership. This is one of the most important commands for forensic timeline work.
wc (word count) counts lines, words, and characters. wc -l access.log quickly tells you how many entries are in a log file, helping you gauge its size before diving in.
Searching and Filtering
These commands are the backbone of log analysis and evidence discovery on Linux.
find locates files based on criteria such as name, type, size, modification time, and permissions. It is one of the most versatile commands in the investigator's toolkit. Examples:
find /home -name "*.php"finds all PHP files under /home (potential web shells)find / -mtime -3finds all files modified in the last 3 daysfind / -perm -4000 -type ffinds all SUID executables on the system
grep searches for text patterns within files. It supports regular expressions and is essential for extracting specific events from log files. Examples:
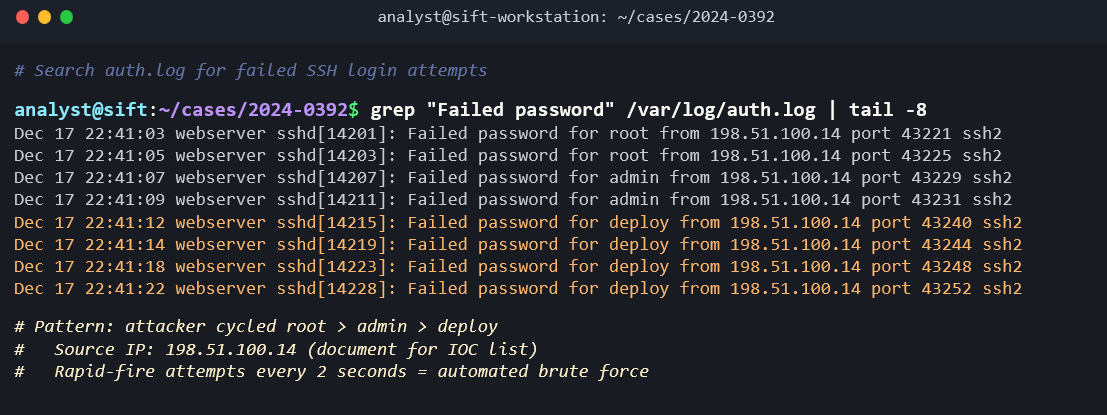
grep "Failed password" /var/log/auth.logextracts all failed login attemptsgrep -i "error" /var/log/syslogperforms a case-insensitive search for errorsgrep -r "eval(" /var/www/html/recursively searches web files for a common PHP web shell indicator
Piping (|) and redirection (>, >>) are what make the Linux command line powerful. The pipe operator takes the output of one command and feeds it as input to the next. Redirection sends output to a file. These operators allow you to build analysis chains:
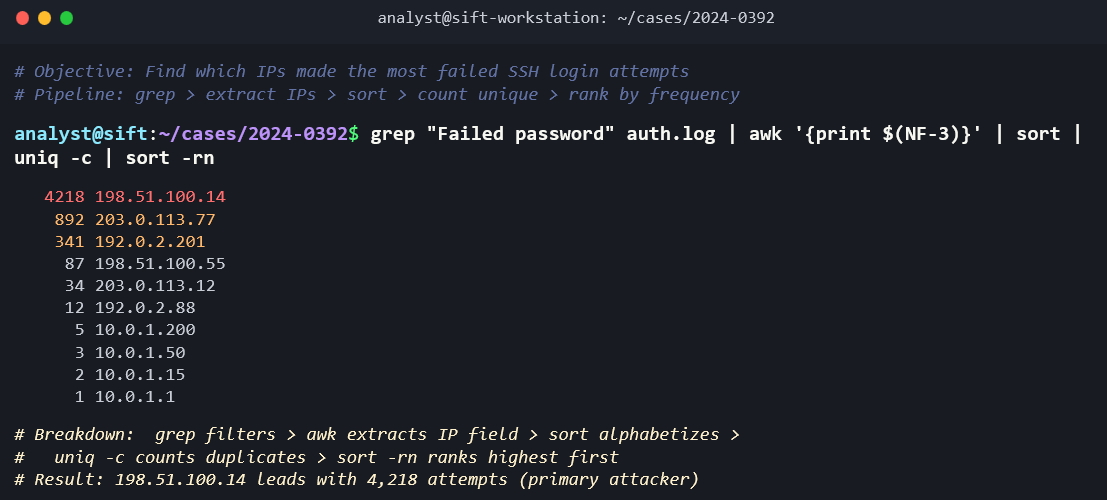
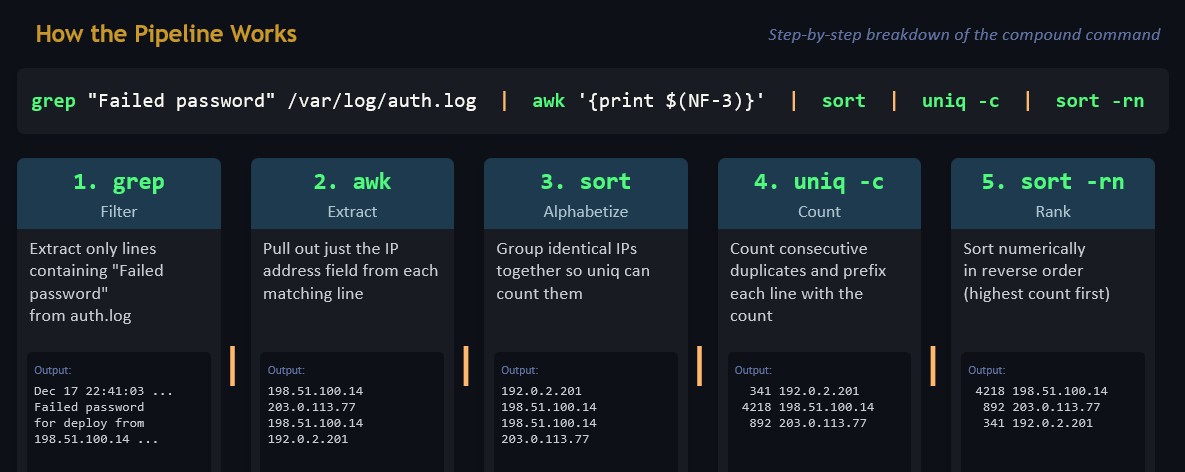
cat /var/log/auth.log | grep "Failed password" | awk '{print $11}' | sort | uniq -c | sort -rn
This single command chain reads the authentication log, extracts failed password entries, pulls out the source IP address (field 11), sorts the results, counts the unique occurrences, and sorts by frequency in descending order. The output is a ranked list of IP addresses that generated the most failed login attempts, which is a brute-force attack indicator.
sort arranges lines alphabetically or numerically. uniq removes adjacent duplicate lines (which is why sort typically precedes it). uniq -c counts the occurrences of each unique line, making it invaluable for frequency analysis. cut extracts specific fields from delimited text. awk is a more powerful field-based text processor that can handle complex parsing tasks.
Analyst Perspective
The command chain shown above is not a theoretical exercise. SOC analysts and forensic investigators build exactly these kinds of pipelines daily to triage log data during incident response. Memorizing individual commands is less important than understanding how to chain them together. Each command does one thing well. Piping lets you assemble them into an analysis workflow that answers specific investigative questions.
System Information
These commands reveal details about the system itself, which is essential context for any examination.
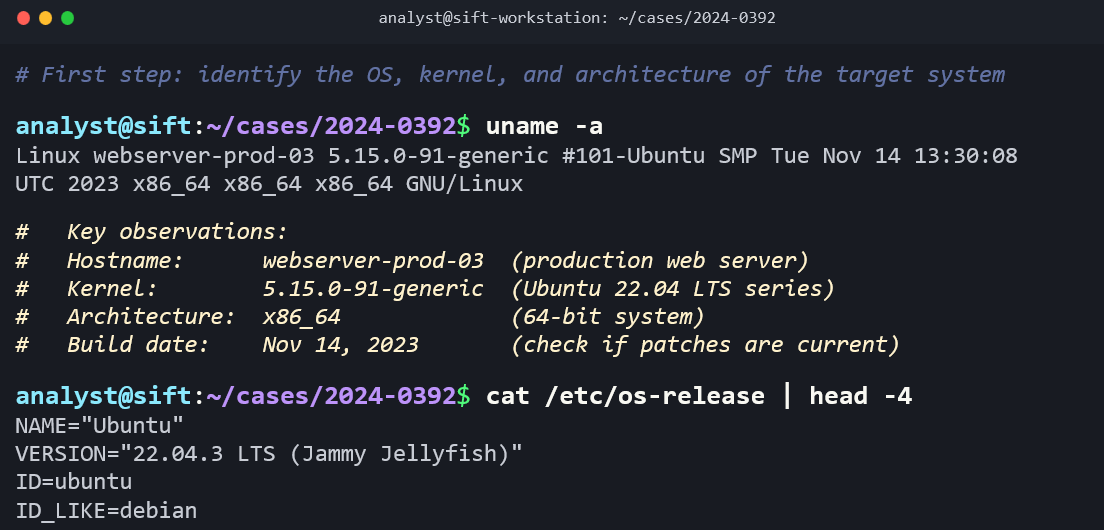
uname -a displays the kernel version, hostname, architecture, and OS information. This tells you exactly what you are examining.
hostname returns the system's hostname, helping you confirm which machine you are analyzing.
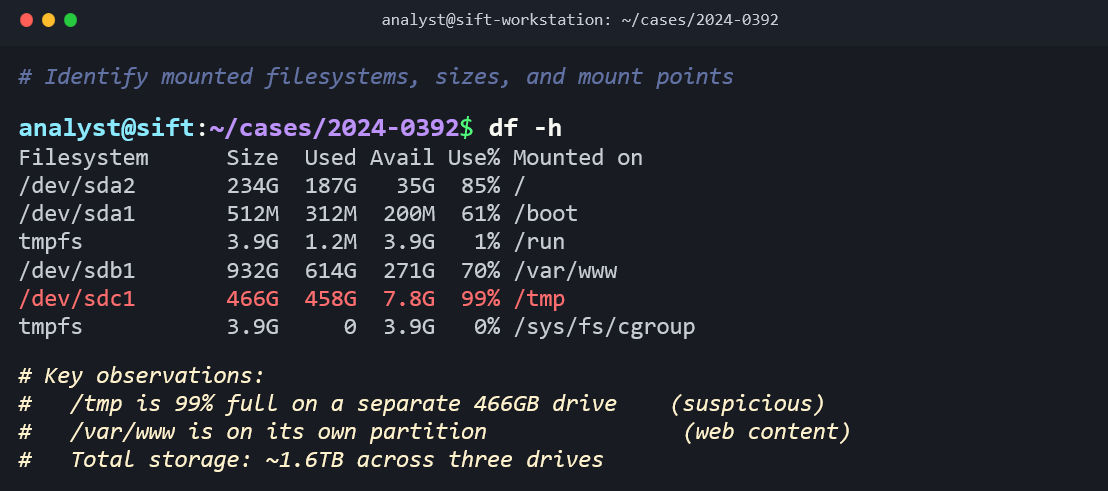
df -h shows disk usage across all mounted file systems. Unusual disk utilization (a nearly full /tmp partition, for example) can indicate data staging.
lsblk lists all block devices (physical drives, partitions, logical volumes) in a tree format. This gives you a quick map of the system's storage layout.
fdisk -l displays the partition table for a specified device, showing partition types, sizes, and starting sectors.
mount (with no arguments) lists all currently mounted file systems and their mount options. On a live system, this shows you what is attached and how.
free -h displays memory usage (total, used, free, cached), providing a snapshot of system resource state.
uptime shows how long the system has been running since its last boot, which tells an investigator when the system was last restarted, a key reference point for timeline analysis.
who and w show currently logged-in users. last reads the /var/log/wtmp file and displays a history of user logins, logouts, and system reboots.
File Operations and Integrity
cp, mv, and rm copy, move, and remove files. The critical forensic note about rm is that it is permanent. Unlike Windows, where deleted files go to the Recycle Bin (Chapter 4), Linux's rm command removes the directory entry immediately. There is no graphical "undo." Desktop environments (GNOME, KDE) do implement a Trash folder, but most server environments have no graphical desktop, and most administrative and attacker activity happens on the command line.
chmod and chown change file permissions and ownership. On a forensic image, you will not use these to modify evidence, but understanding them helps you interpret permission strings you encounter.
md5sum and sha256sum generate cryptographic hash values, connecting directly to the chain of custody principles from Chapter 3. Hashing a forensic image immediately after acquisition and verifying that hash before examination is a non-negotiable step.
dd is the foundational Linux disk imaging tool. The command dd if=/dev/sda of=image.dd bs=4096 creates a bit-for-bit copy of a source drive. In Chapter 3, you learned about the raw/dd image format; this is the tool that creates it. More advanced alternatives like dc3dd add built-in hashing and progress reporting.
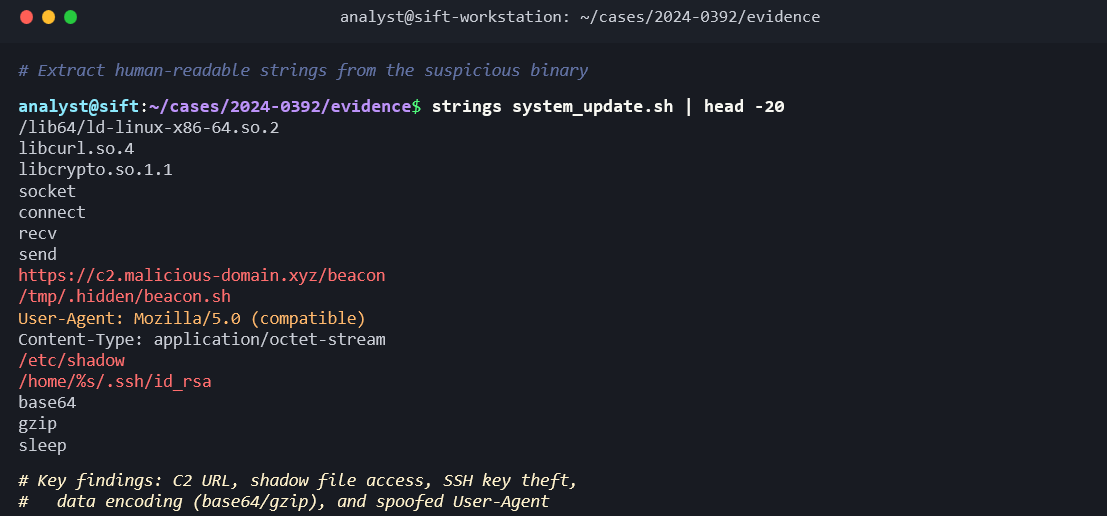
strings extracts printable ASCII and Unicode text from any file, including binary executables and memory dumps. Running strings against a suspicious binary can reveal embedded URLs, IP addresses, commands, and other indicators of compromise.
xxd produces a hex dump of a file, allowing you to examine raw file headers and data at the byte level.
nano is a simple terminal-based text editor. During an examination, you may use it to create notes or examination logs. (On forensic images, you read files; you do not edit evidence.)
Process and Network
These commands are relevant during live response on a running Linux system, when volatile data must be captured before the system is powered down.
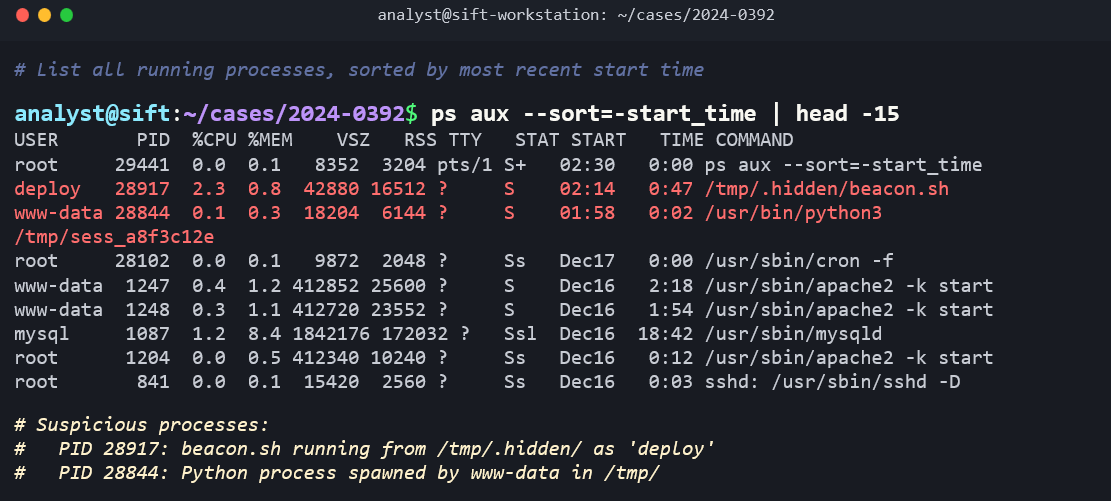
ps aux lists all running processes with their process IDs, users, CPU/memory usage, and the command that launched them. Suspicious processes (unusual names, running from /tmp, or running under unexpected user accounts) are key triage indicators.
top (and its more user-friendly alternative htop) provides a real-time, updating view of system processes and resource usage.
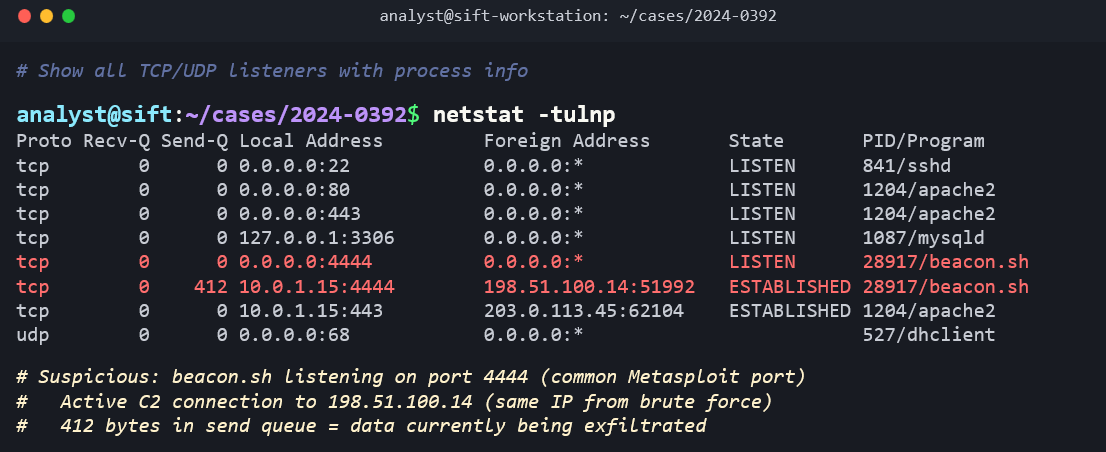
netstat -tulnp and its modern replacement ss -tulnp display active network connections and listening ports. The flags stand for: TCP (-t), UDP (-u), listening (-l), numeric output (-n), and show process names (-p). Identifying unexpected outbound connections or unusual listening ports is a core step in live incident triage.
ip addr show (replacing the older ifconfig) displays the system's network interface configuration, including IP addresses, MAC addresses, and interface status.
11.4 Linux Forensic Artifacts
The investigative value of a Linux system lies in the artifacts it generates during normal operation. Every login, every command, every service start, every network connection produces a trace somewhere in the file system. This section maps the key artifact categories, their locations, and what they reveal to an investigator.
Log Files: The Investigator's Primary Evidence
The /var/log/ directory is the single most important location on a Linux system for forensic analysis. Nearly all system, application, and security logs are written here. Unlike Windows, where event logs are stored in a proprietary binary format (.evtx), most Linux logs are plain text files that can be read directly with cat, grep, less, and the other tools covered in Section 11.3.
The key log files include:
- /var/log/syslog (Debian/Ubuntu) or /var/log/messages (Red Hat/CentOS): The general-purpose system log. Captures a wide range of system events including service starts and stops, kernel messages, and application notices.
- /var/log/auth.log (Debian/Ubuntu) or /var/log/secure (Red Hat/CentOS): Authentication events. This log records every login attempt (successful and failed), every
sudocommand, every SSH connection, and everysu(switch user) event. For most investigations, this is the first log you read. - /var/log/kern.log: Kernel-level messages, including hardware events, driver loading, and USB device connections.
- /var/log/dmesg: Boot-time messages. Useful for determining what hardware was detected at startup.
- /var/log/apache2/ or /var/log/nginx/: Web server access and error logs. The access log records every HTTP request (source IP, timestamp, requested URL, response code, user agent). The error log records server-side failures and application errors.
- /var/log/cron or /var/log/cron.log: Records the execution of scheduled tasks (cron jobs), including which user's crontab triggered the task and when.
- /var/log/dpkg.log (Debian/Ubuntu) or /var/log/yum.log (Red Hat/CentOS): Records all package installations, upgrades, and removals. An attacker who installs tools using the package manager leaves traces here.
syslog vs. journald
Modern Linux distributions that use systemd (which includes virtually all current distributions) have a second logging system called journald. Journald captures the same types of events as syslog but stores them in a binary format rather than plain text. You query journald using the journalctl command:
journalctl -u sshshows all log entries for the SSH servicejournalctl --since "2025-03-01" --until "2025-03-15"filters by date rangejournalctl -p errshows only error-level and above messages
Many distributions run both systems in parallel: journald captures events from systemd services, and syslog receives a copy for writing to traditional text files. Investigators should check both sources.
Warning
Linux log files are subject to log rotation. The logrotate utility automatically compresses and archives old logs on a schedule (daily, weekly, or based on file size). Rotated logs are typically named with a numeric suffix or date stamp (e.g., auth.log.1, auth.log.2.gz). Depending on the rotation policy, logs older than a few weeks may be compressed or deleted entirely. Investigators must check the logrotate configuration (/etc/logrotate.conf and /etc/logrotate.d/) to understand what retention policy was in effect and identify any gaps in the log record.
User Activity Artifacts
Bash History
The ~/.bash_history file in each user's home directory is one of the most forensically valuable artifacts on a Linux system. Every command typed in a Bash shell is recorded here by default. In a compromise investigation, bash history can reveal exactly what an attacker did after gaining access: what files they viewed, what tools they downloaded, what data they exfiltrated, and what they tried to cover up.
Several environment variables control bash history behavior:
- HISTFILE: The path to the history file. Default is
~/.bash_history. - HISTSIZE: The maximum number of commands stored in memory during a session.
- HISTFILESIZE: The maximum number of lines retained in the history file.
- HISTCONTROL: Controls what gets recorded. If set to
ignorespace, commands starting with a space are not recorded. If set toignoredups, consecutive duplicate commands are not recorded.
From an anti-forensic perspective (connecting back to Chapter 10), attackers frequently target bash history. Common techniques include running history -c to clear the in-memory history, deleting the .bash_history file, setting HISTSIZE=0 to prevent recording, or running unset HISTFILE at the start of a session. The absence of a bash history file, or a suspiciously empty one on an active account, is itself an indicator of anti-forensic activity.
SSH Artifacts
The ~/.ssh/ directory in a user's home folder contains several forensically significant files:
- authorized_keys: Lists the public keys authorized to log into this account via SSH without a password. An attacker who adds their own public key to this file establishes persistent, password-less backdoor access.
- known_hosts: Records the fingerprint of every SSH server this user has connected to. This reveals lateral movement targets.
- id_rsa / id_ed25519 (and their .pub counterparts): The user's private and public SSH key pair. The private key, if exfiltrated by an attacker, grants access to any system that trusts the corresponding public key.
Browser Artifacts
If the Linux system has a desktop environment, browser artifacts follow the same patterns you learned in Chapter 7. Firefox stores its profile under ~/.mozilla/firefox/, and Chromium-based browsers store under ~/.config/google-chrome/ or ~/.config/chromium/. The SQLite databases containing history, downloads, cookies, and cached data are structurally identical to their Windows counterparts.
Crontab Entries
Cron is the Linux task scheduler, equivalent in purpose to Windows Task Scheduler. Each user can have their own crontab (viewable with crontab -l for that user), and system-wide scheduled tasks are defined in /etc/crontab and the /etc/cron.d/, /etc/cron.daily/, /etc/cron.hourly/, /etc/cron.weekly/, and /etc/cron.monthly/ directories.
System Configuration Artifacts
The /etc/ directory is the Linux equivalent of the Windows Registry for system configuration, with one major difference: every configuration is stored in a human-readable text file rather than a binary database. Key files include:
- /etc/passwd, /etc/shadow, /etc/group: User account database (covered in Section 11.2).
- /etc/hostname and /etc/hosts: The system's hostname and local DNS override entries. An attacker modifying
/etc/hostscan redirect traffic silently. - /etc/fstab: Defines the file systems that should be mounted at boot, including network shares. This tells an investigator what storage was expected to be connected.
- /etc/sudoers: Defines which users and groups can execute commands as root (or other users) using
sudo. Unauthorized modifications to this file grant privilege escalation. - /etc/ssh/sshd_config: The SSH server configuration file. Investigators should check for non-standard settings such as
PermitRootLogin yes, modified port numbers, or the addition ofAuthorizedKeysFilepaths that point to unusual locations.
Persistence Mechanisms
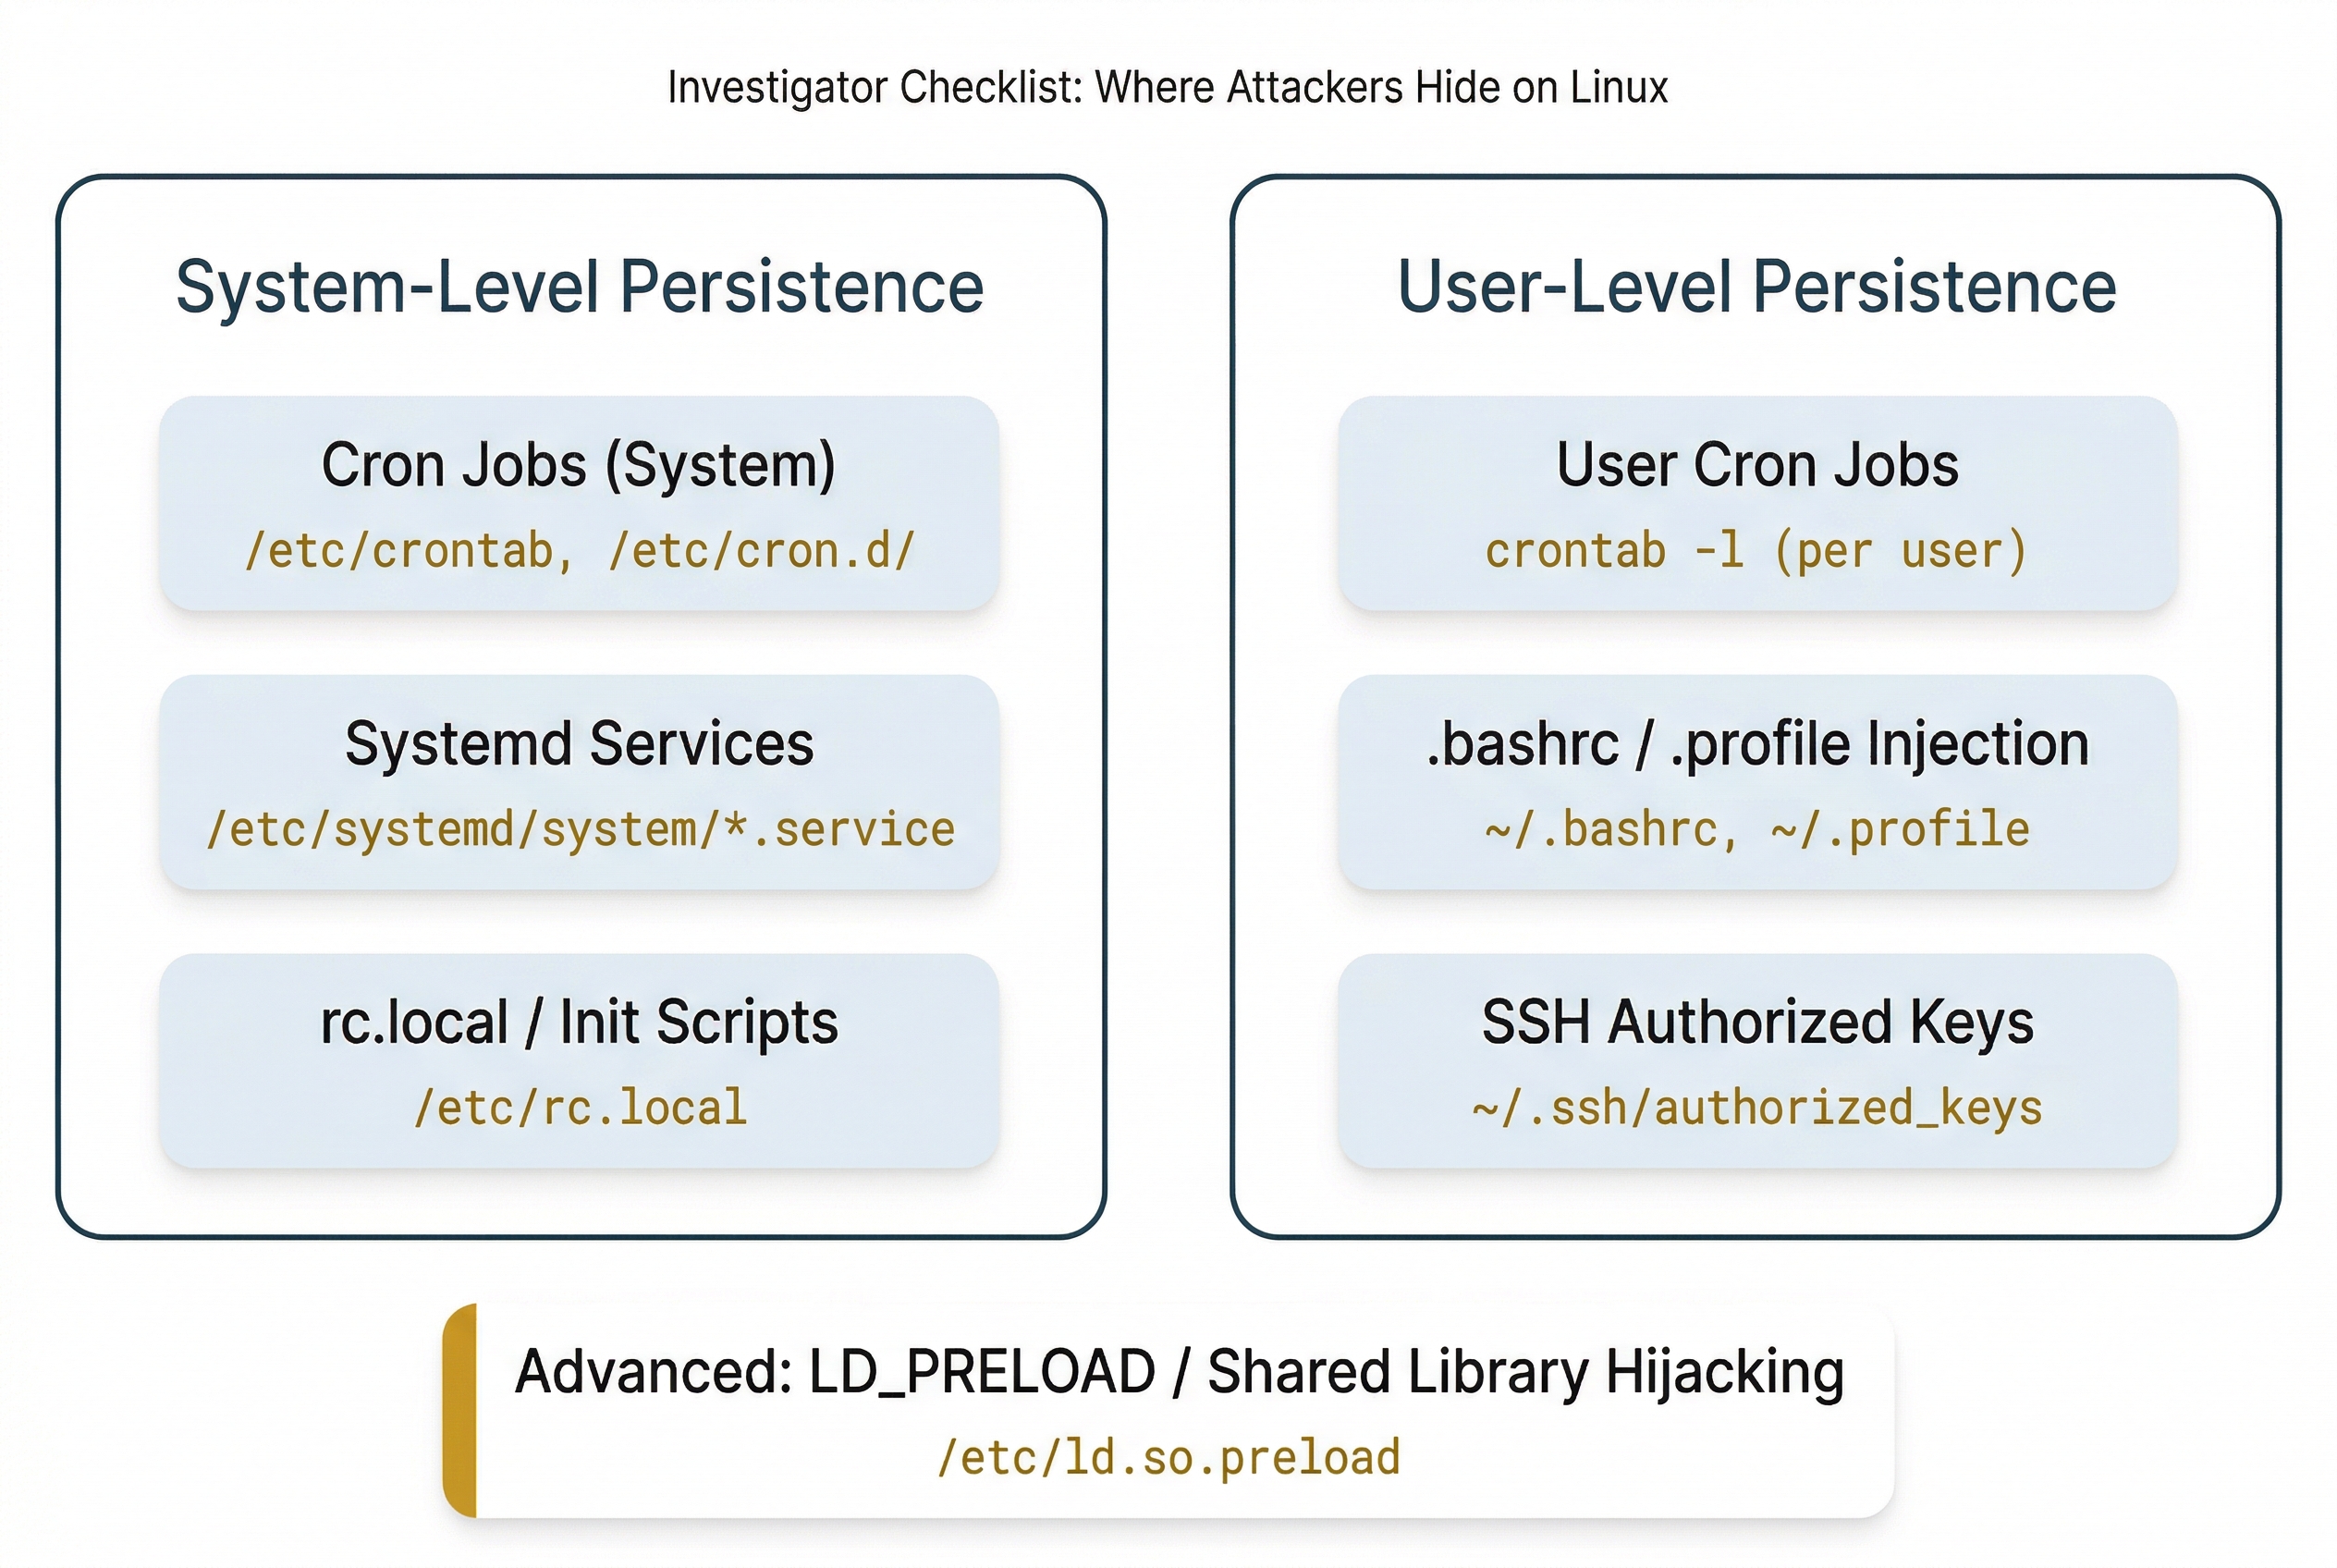
When an attacker compromises a Linux system, maintaining access across reboots requires establishing a persistence mechanism. These are the Linux equivalents of the Windows Registry autostart keys you studied in Chapter 5. The most common persistence techniques include:
- Cron jobs: A malicious cron entry that periodically downloads and executes a payload or opens a reverse shell. Check both system-level (
/etc/crontab,/etc/cron.d/) and per-user (crontab -l) schedules. - Systemd services and timers: An attacker creates a new
.serviceunit file in/etc/systemd/system/that starts a malicious binary at boot. Systemd timers can also trigger periodic execution, similar to cron. - rc.local and init scripts: On older systems,
/etc/rc.localruns commands at the end of the boot process. Attackers may append commands here. - .bashrc / .profile injection: Adding malicious commands to a user's
~/.bashrcor~/.profilecauses them to execute every time the user opens a new shell session. - SSH authorized_keys backdoors: As described above, adding an attacker's public key to
~/.ssh/authorized_keysgrants persistent, password-less access. - LD_PRELOAD and shared library hijacking: An advanced technique where an attacker creates a malicious shared library and configures the system to load it before legitimate libraries, allowing code injection into running processes.
Putting It Together
Scenario: A mid-size e-commerce company contacts your firm after their web application firewall flagged anomalous outbound traffic from their primary web server. The server runs Ubuntu 22.04 with Apache 2.4. A forensic image has been acquired and your task is to determine the scope of the compromise.
Step 1: Authentication Analysis. Mount the image read-only and begin with /var/log/auth.log. Search for failed SSH login attempts: grep "Failed password" auth.log | awk '{print $11}' | sort | uniq -c | sort -rn. The results show 4,200 failed attempts from a single IP address over a 6-hour window, followed by a successful login to the "deploy" service account.
Step 2: Post-Compromise Activity. Navigate to /home/deploy/.bash_history. The attacker's commands are visible: they downloaded a PHP web shell using wget, placed it in /var/www/html/uploads/, modified its permissions to be executable, and then ran history -c (but the history was already written to disk before the clear command took effect).
Step 3: Persistence Check. Examine the deploy user's crontab using the crontab file in the image. A new entry exists: */5 * * * * /tmp/.hidden/beacon.sh. This script runs every 5 minutes and sends a heartbeat to an external IP address, maintaining the attacker's C2 channel.
Step 4: Web Server Log Analysis. Read /var/log/apache2/access.log. Search for requests to the uploaded web shell: grep "uploads/config.php" access.log. The results show 38 POST requests to the web shell from three different source IP addresses over two days, indicating that the shell was actively used for further operations.
Step 5: Timeline Reconstruction. Combine the timestamps from auth.log (initial brute-force and successful login), bash_history file timestamps, the web shell's inode timestamps via stat, and the cron job's creation time to build a complete timeline of the intrusion from initial access through persistence establishment.
This five-step process, grounded entirely in the artifacts and commands covered in this chapter, gives the analyst a clear narrative: the attacker brute-forced SSH access, deployed a web shell, established cron-based persistence, and used the web shell for ongoing access. The timeline provides the legal team with the dates and times needed for their response.
11.5 Forensic Linux Distributions
What Are Forensic Distributions?
A forensic Linux distribution is a purpose-built operating system that comes preconfigured with forensic tools, validated workflows, and (in most cases) default settings designed to protect evidence integrity. These distributions can be booted from a USB drive or installed on a forensic workstation, providing a ready-to-use examination environment without the need to manually install and configure dozens of individual tools.
Forensic distributions matter for several reasons. Their tool chains are tested and validated for use in legal proceedings. Many default to write-blocking behavior, ensuring that connected evidence drives are not inadvertently modified. They provide a consistent, reproducible environment, which strengthens the defensibility of your examination in court.
SANS SIFT Workstation
The SANS Investigative Forensic Toolkit (SIFT) is one of the most widely recognized forensic distributions in the industry. Maintained by SANS and originally developed by Rob Lee, SIFT is built on Ubuntu and is designed for comprehensive disk and memory forensics.
SIFT comes preloaded with tools including Autopsy, The Sleuth Kit, Volatility, log2timeline/Plaso (for super-timeline creation), bulk_extractor, and numerous other utilities. It is the distribution most commonly used in SANS DFIR training courses and is well-suited for detailed forensic examinations where the investigator needs a full analysis environment.
Kali Linux
Kali Linux, maintained by Offensive Security, is built on Debian and is primarily known as a penetration testing distribution. Its default toolset is oriented toward offensive security: network scanning, vulnerability assessment, exploitation, and password cracking.
However, Kali includes a Forensic Mode that can be selected at boot. Forensic Mode prevents the system from mounting any internal drives automatically or enabling swap, protecting evidence from accidental modification. Kali also includes a number of forensic and network analysis tools. While it is not a dedicated forensic platform, its forensic mode makes it useful for live response and network forensic tasks, and many analysts are already familiar with it from their penetration testing work in courses like CFS275.
Tsurugi Linux
Tsurugi is an Italian-developed forensic distribution designed for DFIR, open-source intelligence (OSINT), and malware analysis. It is built with law enforcement use cases in mind and includes a broad set of tools covering disk forensics, memory analysis, network forensics, and OSINT gathering. Tsurugi is particularly well-regarded for its OSINT investigation capabilities.
CAINE (Computer Aided INvestigative Environment)
CAINE is another Italian forensic distribution, built on Ubuntu and designed with an emphasis on a user-friendly graphical interface. CAINE implements write-blocking by default on all connected devices and provides a GUI-oriented workflow that is accessible to investigators who prefer graphical tools over the command line. It is well-suited for disk forensics where a streamlined, GUI-based workflow is preferred.
| Distribution | Base OS | Primary Focus | Write-Block Default | Key Tools | Best Suited For |
|---|---|---|---|---|---|
| SANS SIFT | Ubuntu | Disk & memory forensics | Configurable | Autopsy, Sleuth Kit, Volatility, Plaso | Comprehensive DFIR examinations |
| Kali Linux | Debian | Penetration testing (Forensic Mode available) | In Forensic Mode | Nmap, Wireshark, Hashcat, Volatility | Network forensics, live response, offensive testing |
| Tsurugi | Independent | DFIR, OSINT, malware analysis | Yes | OSINT tools, Autopsy, Volatility | OSINT investigations, malware RE |
| CAINE | Ubuntu | Disk forensics (GUI-focused) | Yes | Autopsy, Guymager, Foremost | GUI-based disk forensic examinations |
Analyst Perspective
Most experienced forensic analysts do not rely on a single distribution. They maintain several bootable USB drives, each with a different distribution, and select the one best suited for the specific case. SIFT for a deep-dive disk and memory examination. Kali in forensic mode for quick network triage and live response. CAINE when the team needs a GUI-driven workflow. Knowing what each distribution offers, and its limitations, lets you pick the right tool for the job.
11.6 Simulated Linux Terminal: Test Your Understanding
Chapter Summary
This chapter transitioned from the Windows-centric forensic toolkit built in Chapters 4 through 10 to the Linux environment that powers servers, cloud infrastructure, IoT devices, and the forensic workstations investigators use daily.
Key concepts covered include:
- Linux is everywhere in investigations. Even Windows-focused cases frequently involve Linux infrastructure, from compromised web servers to cloud-hosted C2 nodes to embedded devices. Investigators who cannot work in Linux will encounter evidence they cannot analyze.
- The Linux file system hierarchy follows the Filesystem Hierarchy Standard. The most forensically relevant directories are
/home(user data),/etc(system configuration),/var/log(logs), and/tmp(temporary files and attacker staging areas). - Ext4 uses inodes as its central metadata structure, serving the same purpose as NTFS MFT entries. The critical forensic difference is that ext4 zeroes out inode block pointers upon file deletion, making metadata-based recovery harder than on NTFS. File carving and journal analysis are the primary recovery strategies.
- Timestamps on Linux include mtime (content modification), atime (access), and ctime (metadata change). Ctime is frequently misunderstood as "creation time" but actually tracks the last metadata change.
- The Linux command line is the primary forensic interface. Commands like
grep,find,sort,uniq, andawkchain together through pipes to build powerful analysis workflows, especially for log analysis. - Log files in
/var/log/are the primary evidence source on Linux systems. Authentication logs (auth.log/secure) are typically the first artifact an investigator examines. Log rotation policies determine how much history is available. - User activity artifacts include bash history (commands typed), SSH artifacts (keys, known hosts), browser profiles, and crontab entries. Bash history is both highly valuable and a frequent target of anti-forensic techniques.
- Persistence mechanisms on Linux include cron jobs, systemd services, rc.local scripts, shell profile injection, and SSH authorized_keys backdoors, serving the same purpose as Windows Registry autostart keys.
- Forensic distributions (SIFT, Kali, Tsurugi, CAINE) provide preconfigured examination environments with validated tool chains and write-blocking defaults. Each distribution has strengths suited to different investigation types.
The commands and artifact locations covered in this chapter are consolidated in the reference tables that follow. These tables are designed as study aids and quick-reference resources that you will return to throughout the remainder of the course and in hands-on lab exercises.
Quick-Reference Tables
Table A: Linux Command Quick Reference:Navigation & File Inspection
| Command | Syntax Example | Purpose | Forensic Use |
|---|---|---|---|
| pwd | pwd |
Print working directory | Verify current location on mounted image |
| ls | ls -la /home/ |
List files with details | View permissions, timestamps, hidden files |
| cd | cd /var/log/ |
Change directory | Navigate to evidence locations |
| cat | cat auth.log |
Display file contents | Read log files and configuration files |
| head / tail | tail -n 50 syslog |
View first or last N lines | Check recent log entries quickly |
| less | less largefile.log |
Paginated file viewer | Browse large log files |
| file | file suspicious.dat |
Identify file type by magic bytes | Detect file extension mismatch (Ch10) |
| stat | stat document.pdf |
Show detailed file metadata | Examine all three timestamps and inode info |
| wc | wc -l access.log |
Count lines, words, characters | Gauge log file size before analysis |
Table B: Linux Command Quick Reference:Searching & Filtering
| Command | Syntax Example | Purpose | Forensic Use |
|---|---|---|---|
| find | find / -name "*.php" -mtime -7 |
Locate files by criteria | Find recently modified files (web shells, backdoors) |
| grep | grep -i "failed password" auth.log |
Search text patterns in files | Extract specific events from log files |
| sort | sort access.log |
Sort lines alphabetically or numerically | Organize log entries for analysis |
| uniq | sort \| uniq -c |
Remove or count duplicate lines | Frequency analysis of log events |
| cut | cut -d' ' -f1 access.log |
Extract fields from delimited text | Isolate IPs or timestamps from logs |
| awk | awk '{print $1}' access.log |
Field-based text processing | Parse structured log fields |
Table C: Linux Command Quick Reference:System Information & Disk
| Command | Syntax Example | Purpose | Forensic Use |
|---|---|---|---|
| uname | uname -a |
Display OS and kernel info | Identify target system version and architecture |
| hostname | hostname |
Display system hostname | Confirm system identity |
| df | df -h |
Show disk space usage | Check for suspicious volume utilization |
| lsblk | lsblk |
List block devices | Map drives, partitions, and logical volumes |
| fdisk | fdisk -l /dev/sda |
Display partition table | Identify partition layout and types |
| mount | mount |
Show mounted file systems | Verify what is attached and mount options |
| free | free -h |
Display memory usage | Snapshot of system RAM state |
| uptime | uptime |
Show system uptime | Determine last reboot time |
| who / w | who |
Show logged-in users | Identify active user sessions |
| last | last |
Display login history | Review historical user login patterns |
Table D: Linux Command Quick Reference:Integrity & Acquisition
| Command | Syntax Example | Purpose | Forensic Use |
|---|---|---|---|
| md5sum | md5sum image.dd |
Generate MD5 hash | Verify forensic image integrity (Ch3) |
| sha256sum | sha256sum image.dd |
Generate SHA-256 hash | Chain of custody hash verification (Ch3) |
| dd | dd if=/dev/sda of=image.dd bs=4096 |
Bit-stream disk copy | Forensic disk imaging (Ch3) |
| strings | strings binary_file |
Extract printable text from any file | Find readable text in binaries or memory dumps |
| xxd | xxd file.bin \| head |
Hex dump of file contents | Examine file headers and raw byte data |
| nano | nano notes.txt |
Simple terminal text editor | Create examination notes during analysis |
Table E: Linux Command Quick Reference:Process & Network
| Command | Syntax Example | Purpose | Forensic Use |
|---|---|---|---|
| ps | ps aux |
List all running processes | Identify suspicious or unexpected processes |
| top / htop | top |
Real-time process monitor | Observe system resource usage |
| netstat | netstat -tulnp |
Display network connections | Identify active connections and listening ports |
| ss | ss -tulnp |
Socket statistics (modern netstat) | Same as netstat, preferred on newer systems |
| ip addr | ip addr show |
Show network interface details | Identify system network configuration |
Table F: Key Linux Forensic Artifact Locations
| Artifact | Location | What It Reveals |
|---|---|---|
| User accounts | /etc/passwd | All accounts, UIDs, home directories, default shells |
| Password hashes | /etc/shadow | Hashed passwords, password change dates, account status |
| Group membership | /etc/group | Group assignments and privilege associations |
| Command history | ~/.bash_history | Commands typed by each user (or attacker) |
| SSH keys | ~/.ssh/ | Authorized keys, known hosts, private key pairs |
| System logs | /var/log/syslog or /var/log/messages | General system events |
| Authentication events | /var/log/auth.log or /var/log/secure | Logins, sudo usage, SSH authentication |
| Web server logs | /var/log/apache2/ or /var/log/nginx/ | HTTP requests, errors, access patterns |
| Cron jobs (user) | crontab -l (per user) | User-level scheduled tasks (potential persistence) |
| Cron jobs (system) | /etc/crontab, /etc/cron.d/, /etc/cron.daily/ | System-level scheduled tasks |
| Systemd services | /etc/systemd/system/ | Service unit definitions (potential persistence) |
| Mounted file systems | /etc/fstab | Expected mount points and network shares |
| Sudo privileges | /etc/sudoers | Who can run commands as root and what commands |
| Network configuration | /etc/network/ or /etc/netplan/ | Static IP assignments, DNS servers, default gateway |
| Installed packages | /var/log/dpkg.log or /var/log/yum.log | Software installation and removal history |
| System hostname | /etc/hostname | System identity |
| Local DNS overrides | /etc/hosts | Manual hostname-to-IP mappings (potential traffic redirection) |
| SSH server config | /etc/ssh/sshd_config | SSH access settings, allowed authentication methods |