CH14: Proactive Operations - Threat Hunting
Introduction
The SOC analyst opens the monthly metrics dashboard on the first Monday of the month. The numbers look good. Mean Time to Detect (MTTD) on confirmed incidents has dropped to four hours. Mean Time to Respond (MTTR) is under twenty-four. The alert backlog is empty. Leadership is happy. The analyst, however, is not.
She scrolls to a different panel. The development network segment, twenty-three workstations and four servers used by the engineering team, has not generated a single SIEM alert in six months. The segment has full logging coverage. The detection rules are deployed. The endpoints are healthy. And yet, six months of silence. There are two possible explanations. The first is that nothing bad has happened on those systems in half a year. The second is that something is happening, and the attacker is patient enough, careful enough, and quiet enough that no rule has fired.
This is the moment that separates a reactive security operation from a proactive one. A reactive analyst closes the dashboard and moves on to the day's tickets. A proactive analyst opens a hunt.
Every chapter of this book so far has been reactive. Something happens, and the incident response (IR) lifecycle kicks in. Detection triggers, analysis investigates, containment limits the damage, eradication removes the threat, recovery restores the business, and the post-incident review captures the lessons. The model assumes that something will eventually trigger an alert. Threat hunting reverses that assumption. Instead of waiting for the alert, the hunter formulates a hypothesis about what a compromise would look like, then deliberately searches for the evidence that would confirm or refute it.
Threat hunting occupies a unique position on the timeline introduced in Chapter 1. It is a proactive activity (a Left of Boom mindset) that uses reactive data (Right of Boom artifacts and telemetry) to find threats that bypassed detection (a Boom that never triggered an alert). It is the discipline that closes the loop, taking discoveries from the field and feeding them back into Preparation (Chapter 6) and Detection (Chapter 7) so that the next attempt is harder and the next dwell time is shorter.
This is the final chapter of CFS256, and it is intentional that the course ends here. By now you know how to plan, detect, respond, and recover. Threat hunting is how you stop waiting and start looking.
Learning Objectives
By the end of this chapter, you will be able to:
- Explain the difference between reactive detection and proactive threat hunting, and articulate why both are necessary for a mature security program.
- Apply the Threat Hunting Maturity Model (HMM) to assess an organization's hunting capability and identify the prerequisites for advancing to higher maturity levels.
- Construct a hunt hypothesis from threat intelligence, map it to MITRE ATT&CK techniques, and identify the data sources required to test the hypothesis.
- Differentiate between file-based hunting tools (YARA), network-based hunting tools (RITA), log-based detection rules (Sigma), and statistical analysis (frequency stacking), and explain when each is appropriate.
- Design a Purple Team validation cycle that tests existing detections, documents gaps through ATT&CK coverage mapping, and feeds hunt discoveries into stable SIEM/EDR detection rules.
14.1 From Reactive to Proactive
Reactive detection is the foundation of every Security Operations Center (SOC). A rule fires, an analyst investigates, and the IR lifecycle takes over. The model works, and it scales, but it has a structural limitation. Reactive detection can only catch what it was built to recognize. Anything outside that recognition window passes through silently.
Figure 14.1 shows the two postures side by side. The top band is reactive detection: alerts trigger, analysts respond, and the work ends when the rules run out of things to say. The bottom band is proactive hunting: analysts formulate hypotheses, query telemetry, and document findings that feed back into the detection stack. The dashed region in between is the detection gap where neither signatures nor rules help, and it is the operational space that threat hunting is designed to cover.
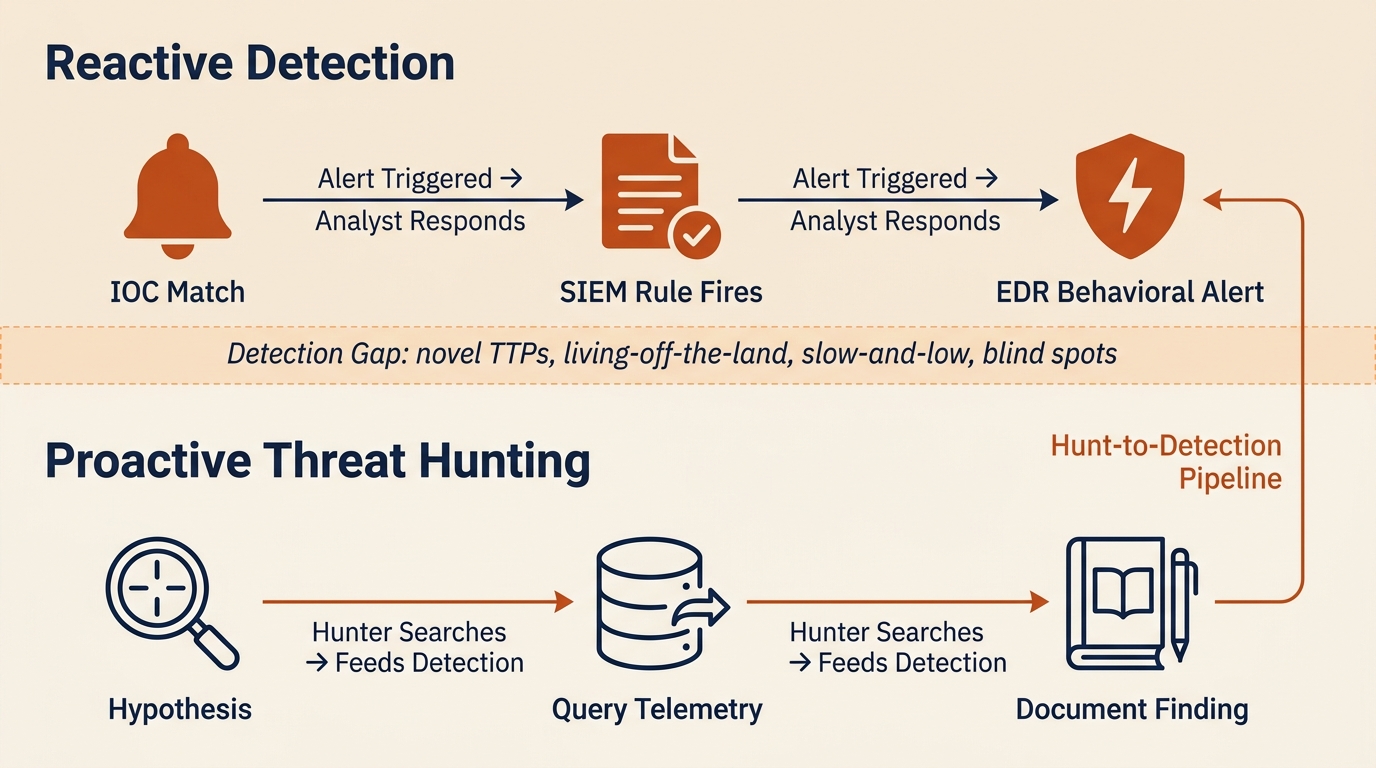
Figure 14.1: Reactive detection and proactive threat hunting as complementary layers, separated by the detection gap where novel TTPs, living-off-the-land behavior, and slow-and-low activity evade signature-based controls.
The Detection Gap
Reactive detection catches three categories of threats well. Known-bad indicators of compromise (IOCs), such as file hashes, IP addresses, and domains pulled from threat intelligence feeds, generate high-fidelity alerts when they appear in the environment. Rule-based correlations, such as a SIEM rule that fires when a single user account fails ten authentications and then succeeds from a new country, catch patterns that defenders have seen before. Behavioral signatures in modern Endpoint Detection and Response (EDR) products catch known malicious sequences such as a Word process spawning PowerShell and then writing an executable to disk.
What reactive detection misses is everything that does not match those models:
- Novel tactics, techniques, and procedures (TTPs) with no existing signature. The first time an attacker chains a new abuse pattern, no rule exists for it.
- Living-off-the-land (LotL) attacks that use legitimate administrative tools such as PowerShell, Windows Management Instrumentation (WMI), PsExec, and certutil. The tools themselves are not malicious, so the activity blends with normal administration.
- Slow-and-low activity that stays below alert thresholds. A rule that fires on twenty failed logons in five minutes does not fire on two failed logons per day for thirty days.
- Activity in poorly logged segments. If a network zone has no EDR or insufficient log forwarding, no rule can fire because no data exists for the rule to evaluate.
The "dwell time" problem from Chapter 12 is the practical consequence of the detection gap. Ransomware operators commonly dwell five to fourteen days before encryption. Advanced Persistent Threat (APT) groups can dwell for months or years. That entire window represents activity that reactive detection failed to catch. Threat hunting exists to compress that window by actively searching for what the rules missed.
Warning
Reactive detection and threat hunting are not competing approaches. They are complementary layers. A program with strong reactive detection and no hunting will catch the noisy attacks and miss the patient ones. A program with hunting and no reactive detection will burn out its analysts chasing every anomaly. Both are required.
The Threat Hunting Maturity Model
David Bianco's Threat Hunting Maturity Model (HMM) provides a framework for assessing where an organization sits on the reactive-to-proactive continuum. The model defines five levels, each with prerequisites that must be met before advancing.
| Level | Name | Description | Characteristics |
|---|---|---|---|
| HMM0 | Initial | Primarily reliant on automated alerting | No dedicated hunting capability; SOC responds only to alerts; little to no log centralization |
| HMM1 | Minimal | Incorporates threat intelligence indicators | Searches for known IOCs (hashes, IPs, domains) but does not formulate original hypotheses; SIEM in place |
| HMM2 | Procedural | Follows hunting procedures created by others | Uses published hunt playbooks and community-shared procedures; beginning to use data analysis techniques |
| HMM3 | Innovative | Creates new hunting procedures | Develops original hypotheses, creates custom analytics, shares findings with the community |
| HMM4 | Leading | Automates successful hunts into detection | Hunt discoveries are systematically converted into automated detection rules; continuous validation cycle |
Figure 14.2 renders the same progression as an ascending staircase so the prerequisites for each level are easier to read at a glance. Notice that the vertical axis is not labeled "tools." It is labeled "data, discipline, and automation." Organizations get stuck on the staircase most often because they lack the logging and documentation to support the next rung, not because they lack the right product.
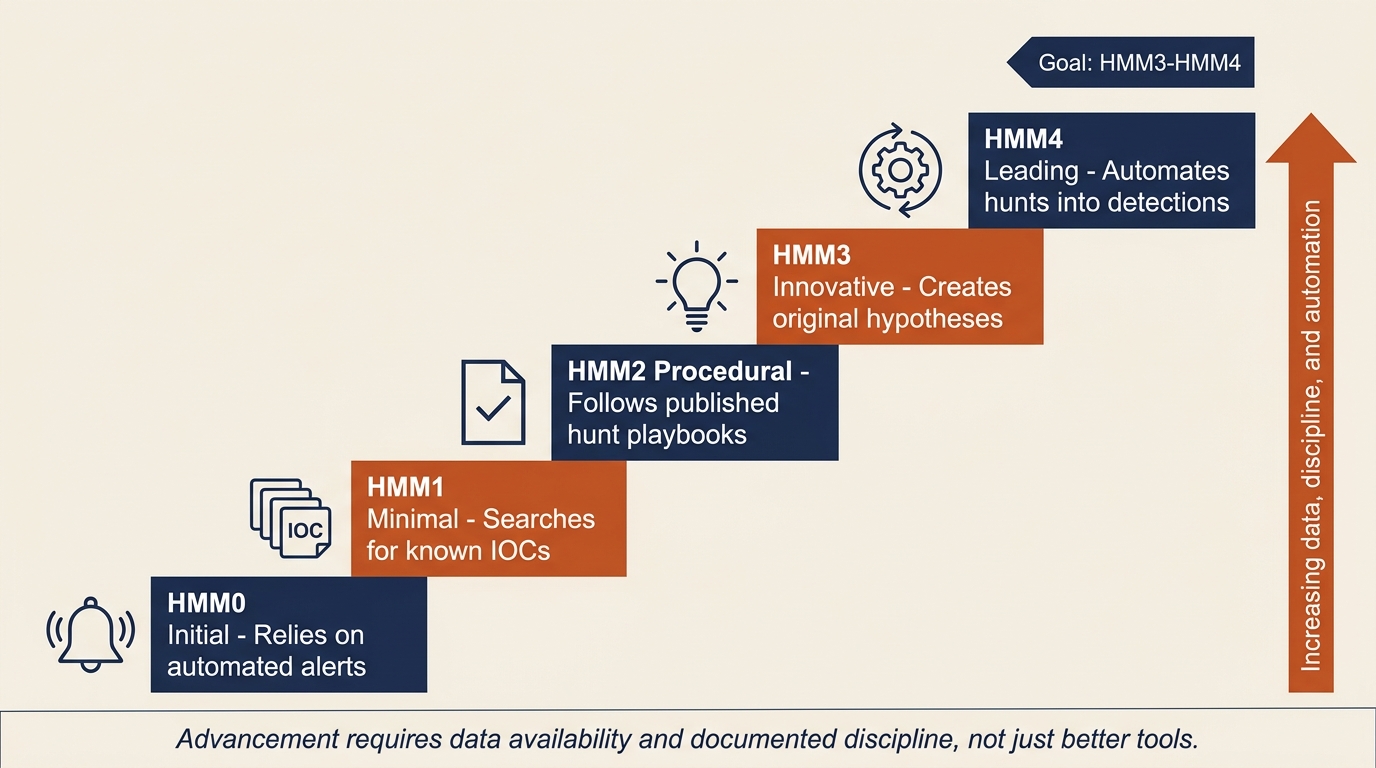
Figure 14.2: The Threat Hunting Maturity Model (HMM) visualized as a staircase. Each step depends on the preceding one, and advancement is driven by data availability and documented discipline rather than by purchasing additional tooling.
Most organizations operate at HMM0 or HMM1. They have a SIEM, they ingest threat feeds, and they search for IOCs when a new advisory drops. That is valuable work, but it is not hunting in the full sense. The goal of this chapter is to give you the conceptual tools to operate at HMM2 and HMM3, and to understand what HMM4 requires of an organization.
Advancing through the model is not primarily a tooling problem. It is a data and discipline problem. You cannot hunt in data you do not have. An organization that wants to move from HMM1 to HMM2 must first verify that the data sources required by published hunt procedures are actually being collected, retained, and made queryable. That work happens in the Preparation phase covered in Chapter 6, and it is the most common reason hunting programs stall.
Data Sources for Hunting
A hunter is only as effective as the telemetry available to query. Before any hunt begins, the team must understand what data exists, how long it is retained, and where the blind spots are. Each data source connects back to a chapter where it was first introduced as part of the IR lifecycle:
- Endpoint telemetry including EDR process creation logs, file system activity, registry modifications, and command-line arguments (Chapter 7).
- Network flow data including NetFlow/IPFIX records, DNS query logs, proxy logs, and full packet capture where available (Chapter 7).
- Authentication logs including Active Directory event logs, VPN access logs, and cloud identity provider logs from Microsoft Entra ID, Okta, or Google Workspace (Chapters 6 and 7).
- Email logs including message trace, mail flow rules, and attachment analysis output from the email security gateway (Chapter 13).
- Cloud audit logs including the Microsoft 365 Unified Audit Log, AWS CloudTrail, and Azure Activity Log (Chapter 13).
Before launching a hunt program, perform a logging gap assessment. For each data source, document what is collected, what retention period is enforced, and what is missing. Blind spots are not just theoretical risks. They are the priorities for the next preparation cycle. A hunt that cannot run because the data does not exist is itself a finding, and it belongs in the next IR plan revision.
14.2 The Hunt Cycle
Hunting is not an unstructured exploration of logs. It is a repeatable process built around hypotheses, evidence, and documentation. Two complementary approaches dominate the field: hypothesis-driven hunting and intelligence-driven hunting.
Hypothesis-Driven Hunting
The core method of hypothesis-driven hunting can be reduced to a single sentence:
If we were compromised by [Actor or Technique X], we would expect to see [Artifact Y] in [Data Source Z].
Each hunt begins with a statement in that form. The hypothesis is testable, the expected evidence is specific, and the data source is identified before any query runs. This discipline matters because it forces the hunter to commit to what they are looking for. Without it, hunting devolves into staring at dashboards and hoping something looks suspicious.
The MITRE ATT&CK framework is the most useful catalog for building hypotheses. ATT&CK organizes adversary behavior into tactics (the attacker's goals) and techniques (the methods used to achieve them). To build a hypothesis from ATT&CK, select a technique relevant to your environment, define what its execution would look like in your data, and identify which log source would record it. For example, technique T1059.001 (PowerShell) is commonly used by attackers for execution. The expected observable is encoded PowerShell commands appearing in process creation logs or in Windows Event ID 4104 (Script Block Logging). The data source is the EDR or the Windows Event Log forwarded to the SIEM. The hunt query searches for those events filtered to encoded or obfuscated command lines.
Hypothesis sources are not limited to ATT&CK. Useful hypotheses also come from recent threat intelligence reports, post-incident findings from prior IR engagements (the Chapter 11 Post-Incident Review), industry-specific threat advisories from the Cybersecurity and Infrastructure Security Agency (CISA), and ATT&CK coverage gaps identified during prior Purple Team exercises. A mature hunt team maintains a backlog of hypotheses drawn from all of these sources.
Intelligence-Driven Hunting
Intelligence-driven hunting starts at the other end of the funnel. Instead of beginning with a behavioral pattern, it begins with specific indicators. When a new CISA advisory or vendor threat report publishes IOCs and TTPs for an active campaign, the hunt team searches its retained logs for any historical evidence that those indicators appeared in the environment before the advisory was issued.
The two approaches answer different questions. Hypothesis hunting asks, "If this kind of attack were happening, would we see it?" Intelligence-driven hunting asks, "Did this specific attack already happen here without our noticing?" Both are necessary. A program that only does intelligence-driven hunting can find yesterday's attacks but not tomorrow's. A program that only does hypothesis hunting can miss the obvious match when a vendor publishes a hash of malware that is already on a server.
Structuring the Hunt
A documented hunt has three phases: planning, execution, and documentation. Figure 14.3 places the three phases in sequence with the hypothesis formula displayed as the banner that anchors the entire cycle. Notice the three outcome chips at the bottom: positive, null, and inconclusive all count as valid results, and all three are documented with equal care.
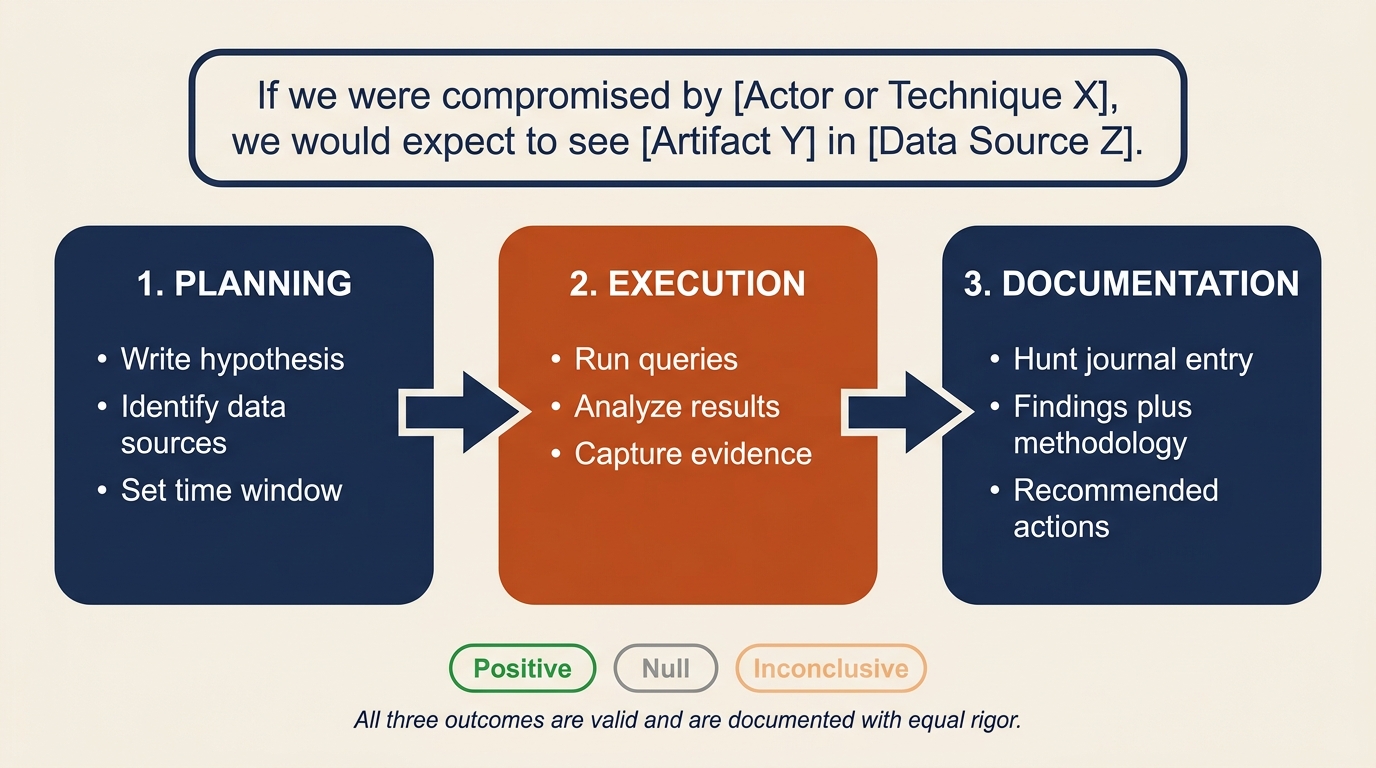
Figure 14.3: The three-phase hunt cycle anchored by the hypothesis formula. Every hunt begins with a testable claim, runs against identified data sources, and ends with a written hunt journal entry regardless of whether the finding was positive, null, or inconclusive.
Planning defines the hypothesis, identifies the data sources, sets the time window for the search, and documents the methodology before any query runs. This is the equivalent of writing the test plan before writing the test. It prevents the hunt from drifting and makes the results reproducible.
Execution runs the queries, analyzes the results, and captures the evidence. Findings can be positive (the hypothesized activity was observed), null (no evidence of the activity was found), or inconclusive (the data was insufficient to decide).
Documentation is the most overlooked and most important phase. Every hunt must produce a written record, often called a "hunt journal" entry, that captures the hypothesis, the data sources queried, the time window, the methodology, the findings, and the recommended actions. Hunts that are not documented cannot be reviewed, repeated, or converted into permanent detections. They simply evaporate.
Analyst Perspective
A null result is not a failed hunt. It is evidence that either the threat is not present in the environment (good news) or that the data sources are insufficient to detect it (a gap to address). Both outcomes are valuable. Document null results with the same rigor as positive findings. The hunt journal is how the program improves over time, and a null entry that says "we searched for T1003.001 across thirty days of EDR data and found nothing" is a meaningful claim about the environment's security posture.
14.3 Hunting Tools and Methodologies
Four tool categories cover most of the hunting landscape. Each operates on a different data domain and answers a different kind of question. The chapter introduces what each one does and when to reach for it. The hands-on syntax and rule construction are covered in the Chapter 14 lab exercise.
YARA: File and Binary Pattern Matching
YARA is the standard tool for describing textual or binary patterns in files. A YARA rule defines one or more strings (text, hex, or regular expressions) along with a condition that determines when the rule matches. Rules can be distributed across an environment and run against files on disk, files in memory, or files captured from network traffic.
Reach for YARA when the question is "is this specific file or family of files present somewhere in our environment?" Common uses include scanning endpoints for known malware families, sweeping file shares for suspicious executables, and validating that a particular ransomware variant identified during an incident is or is not present elsewhere. The strain identification work introduced in Chapter 12 frequently relies on YARA matching against community rule sets such as those maintained by the YARA-Rules project and individual researchers.
Sigma: Log-Based Detection Rules
Sigma is to logs what YARA is to files. It provides a generic, vendor-agnostic signature format for log-based detections. A Sigma rule describes a pattern in log data using a structured YAML format, and a converter translates that rule into the query language of the target SIEM, whether that is Splunk Search Processing Language (SPL), Elastic Query DSL, Microsoft Sentinel Kusto Query Language (KQL), or another platform's syntax.
Reach for Sigma when the question is "does this behavioral pattern appear in our log data, and can we share the detection across teams?" Sigma is the lingua franca of the open detection community. Threat researchers publish Sigma rules for newly observed TTPs, and any organization can import those rules and convert them to their native SIEM language. When a hunt discovers a new behavioral indicator, codifying the finding as a Sigma rule lets the team deploy it to the SIEM for continuous automated detection. This is the practical mechanism behind the hunt-to-detection pipeline introduced later in this chapter.
RITA: Network Beacon Detection
Real Intelligence Threat Analytics (RITA) is an open-source framework that analyzes Zeek (formerly Bro) network logs to detect beaconing behavior. A beacon is the regular, periodic communication between a compromised host and a command-and-control (C2) server. Modern offensive frameworks such as Cobalt Strike, Sliver, and Mythic all rely on beaconing because it allows the operator to retain control of an implant without holding a continuously open session.
Beacons are difficult to catch with signature-based network detection because the traffic itself often looks like legitimate HTTPS or DNS. RITA does not look at the content of the traffic. It looks at the timing. By measuring the intervals between connections from a single source to a single destination, RITA can identify hosts that are communicating with statistical regularity, even when the implant uses jitter (deliberate randomization) to disguise the pattern.
Reach for RITA when the question is "is anything in our environment talking to the same external destination on a regular cadence?" The tool is especially useful for hunting low-and-slow C2 channels and DNS-based C2 that evades the IDS/IPS. Containment of C2 channels was introduced in Chapter 9 as a priority during active incidents. RITA provides the proactive method for finding the channels that the IDS missed.
Frequency Analysis (Stacking)
Frequency analysis, often called "Least Frequency of Occurrence" stacking, inverts the usual hunting logic. Instead of looking for known-bad, stacking looks for rare. The hunter pulls a population of events (process executions, DNS queries, scheduled tasks, installed services) and ranks them by how often each value appears. The most common values are usually benign infrastructure noise. The least common values are candidates for investigation.
The hypothesis behind stacking is: "What is happening on this network that is not happening anywhere else?" Attackers blend in with normal traffic, but their tooling and infrastructure are, by definition, not normal in the victim environment. A workstation running a process that no other workstation runs, a DNS query to a domain queried by no other host, a scheduled task with a name unique to a single server: each of these is the kind of statistical outlier that signature-based detection cannot catch but stacking surfaces immediately.
A simple stacking exercise takes ten minutes and often produces leads. Pull all outbound DNS queries from the proxy logs for the last seven days, group by destination domain, and sort ascending. The top of the list is Microsoft, Google, and the content delivery networks. The bottom of the list, the domains queried by one or two hosts, is where the C2 candidates live. Figure 14.5 shows what this looks like in practice: the common destinations anchor the top of the chart and the low-frequency domains at the bottom are the hunt candidates.
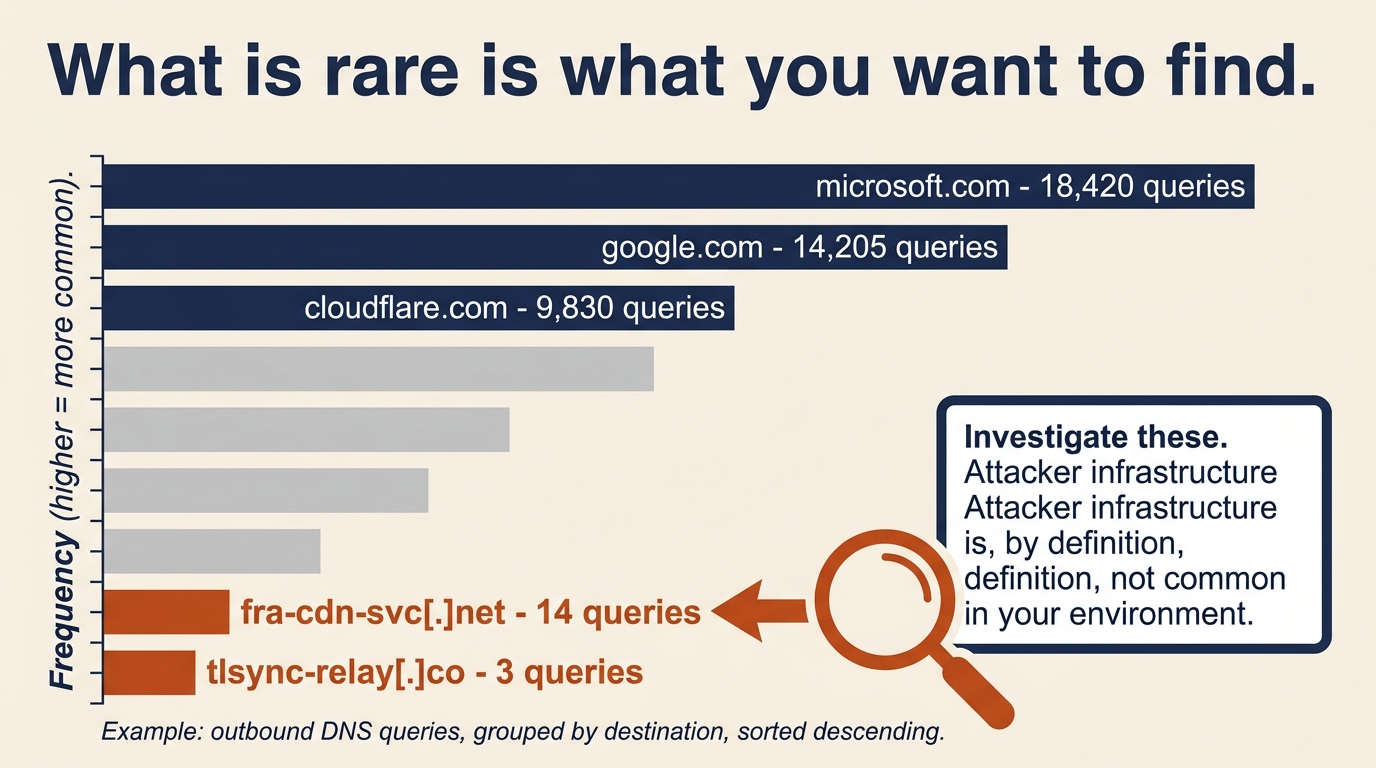
Figure 14.5: Frequency stacking inverts the usual hunting logic. The most common destinations are the benign infrastructure noise; the rare destinations at the bottom of the list are where attacker C2 infrastructure tends to surface.
| Tool | Data Domain | Primary Question | Typical Output |
|---|---|---|---|
| YARA | Files and memory | Is this specific file or family present anywhere? | Rule match with file path and hash |
| Sigma | SIEM log data | Does this behavioral pattern appear in logs? | Converted query for the target SIEM |
| RITA | Zeek network logs | Is anything beaconing on a regular cadence? | Ranked list of beacon candidates |
| Stacking | Any structured data | What is rare in this environment? | Frequency-sorted list of outliers |
Figure 14.4 presents the same four tools as a quick-reference card grid, mapping each to its primary question and a representative use case. Keep it nearby during the Chapter 14 lab; the decision of which tool to reach for is usually decided by the data domain rather than by personal preference.
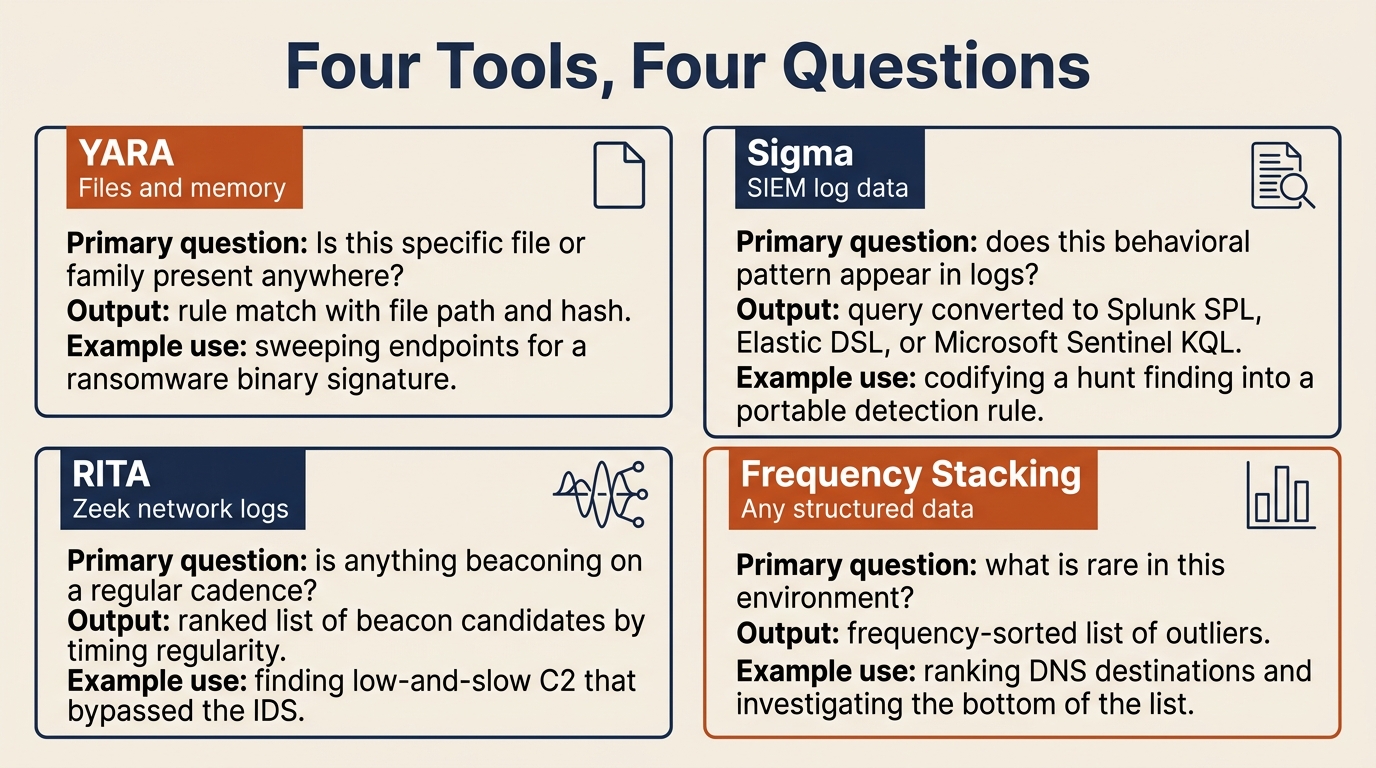
Figure 14.4: Quick-reference card grid for the four core hunting tool categories. The choice between them follows from the data domain: files, logs, network flows, or structured populations.
14.4 Adversary Emulation
Hunting answers the question, "What did we miss?" Adversary emulation answers a related but distinct question: "Do our detections actually work?"
The Purpose of Emulation
Adversary emulation differs from penetration testing in both goal and method. A penetration test asks, "Can we break in?" The pen tester succeeds by gaining unauthorized access and reports the exploited vulnerabilities. Adversary emulation asks, "If a specific adversary used a specific technique against us, would our detection and response capabilities catch it?" The emulator succeeds by executing realistic adversary behavior in a controlled way and measuring whether the SOC saw it.
The output of an emulation exercise is not a list of vulnerabilities. It is a validated map of the detection stack: which techniques are caught, which are missed, and which are caught but produce no actionable alert. For organizations building toward HMM3 and HMM4, that map is the starting point for everything else.
Atomic Red Team
Atomic Red Team is an open-source library, maintained by Red Canary, of small focused tests called "atomics." Each atomic executes a single MITRE ATT&CK technique in a controlled, reversible manner. The library is organized by technique ID, so an analyst can look up T1003.001 (LSASS Memory Dump), find the corresponding atomic, run it on an authorized test system, and verify whether the EDR or SIEM produced the expected alert.
The value of Atomic Red Team for a hunting team is that it provides the validation mechanism for hunt findings. If a hunt discovers that the organization has no detection for credential dumping via Mimikatz-style LSASS access, Atomic Red Team provides the test case that confirms the gap exists, the test case to verify that a newly written detection actually fires, and the test case to re-run a month later to confirm that the detection still works after the next EDR agent update. The library is the bridge between "we think we have coverage" and "we have proof of coverage." Hands-on execution of Atomic Red Team tests is covered in the Chapter 14 lab exercise.
Warning
Adversary emulation tools execute real attack techniques. They must only be run on systems you are authorized to test, in coordination with the SOC, and with a clear rollback plan. An unannounced atomic test that triggers a real incident response is an embarrassment at best and a career-ending mistake at worst. Coordinate every emulation exercise in writing.
14.5 The Purple Team Loop and Detection Engineering
The Purple Team is the organizational structure that connects offensive validation (the "red" function) with defensive detection engineering (the "blue" function). In a mature program, the Purple Team is not a separate team but a recurring collaboration between hunt analysts, detection engineers, and adversary emulators. Its outputs are coverage maps, validated detections, and a continuously improving SIEM rule set.
ATT&CK Coverage Mapping
Coverage mapping is the practice of taking every detection rule the organization owns (SIEM correlation rules, EDR custom detections, YARA rules, Sigma rules) and mapping each one to the MITRE ATT&CK technique it is intended to catch. The result is a heatmap: a grid of ATT&CK tactics across the top and techniques down the side, with each cell colored to show whether the technique is covered and validated, covered but untested, or has no coverage at all.
| Status | Meaning | Example |
|---|---|---|
| Covered and validated | Detection exists and was confirmed working by an Atomic Red Team test within the last 90 days | T1059.001 PowerShell (encoded command detection, last validated 30 days ago) |
| Covered but untested | Detection exists but has not been validated against a real test case | T1003.001 LSASS dump (rule deployed but never validated) |
| No coverage | No detection rule exists for this technique | T1556.006 MFA Request Generation (no rule, no test) |
Not all coverage gaps are equal. A technique used by every ransomware crew that targets your industry is a higher priority than a technique only seen in a single nation-state campaign against a different sector. Use threat intelligence to identify which APT groups and criminal crews are most relevant to your organization, then prioritize the coverage gaps for the techniques those actors actually use. The ATT&CK Navigator tool provides a free, browser-based interface for building and sharing coverage layers.
Figure 14.6 shows what a simplified coverage map looks like when rendered across the ATT&CK matrix. Green cells are techniques with validated detections, gold cells are rules that exist but have not been confirmed with an adversary emulation test, and gray cells are blind spots. In this sample, credential access is weaker than execution, which is a common pattern and a useful way to direct the next round of detection engineering work.
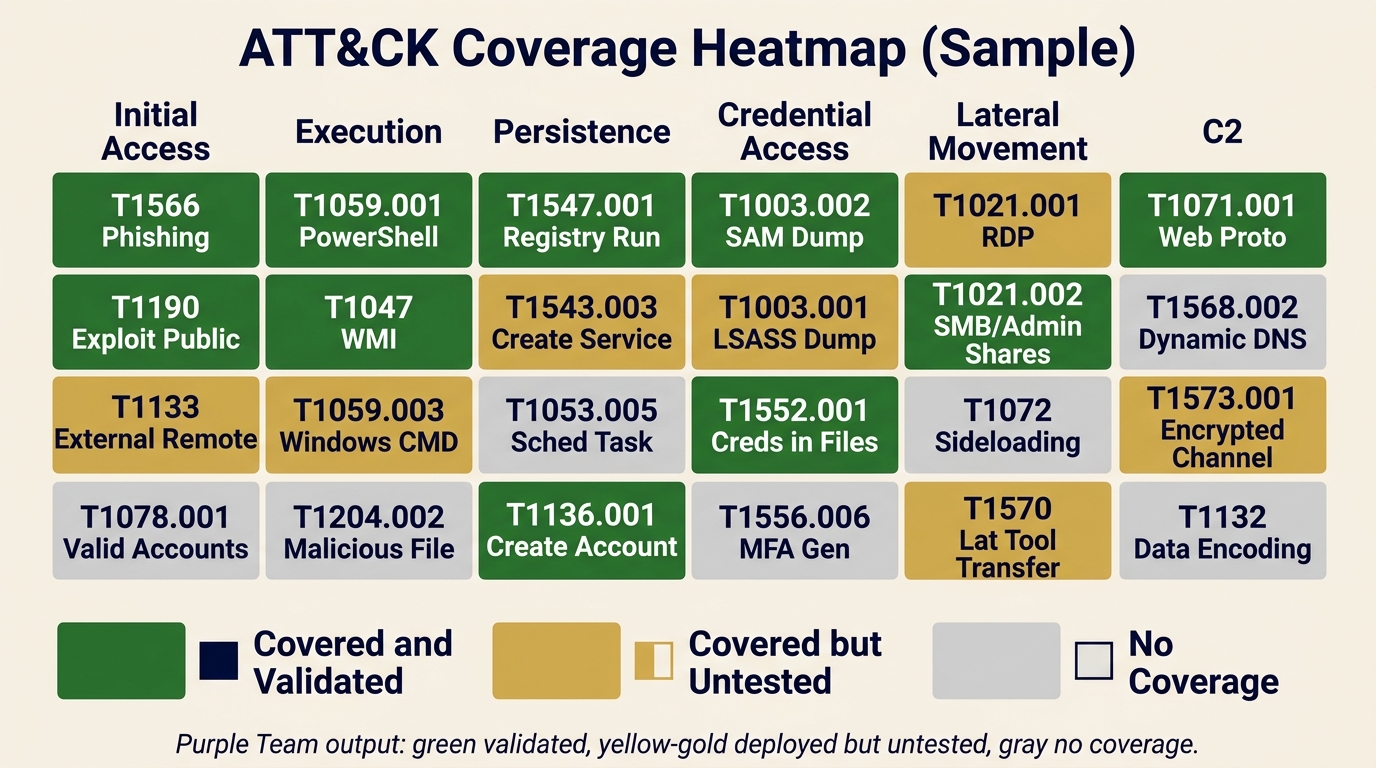
Figure 14.6: Sample ATT&CK coverage heatmap produced by a Purple Team exercise. Green indicates validated detections, gold indicates deployed but untested rules, and gray indicates no coverage. The legend pairs each color with a shape icon so the diagram remains readable for color-blind users.
The Hunt-to-Detection Pipeline
A hunt that finds something interesting is only valuable if the finding is converted into a permanent detection. Otherwise the same hunt has to be re-run by hand every time a similar attack might occur. The hunt-to-detection pipeline is the disciplined process for making that conversion, and Figure 14.7 shows the full seven-step sequence with its feedback loop back into the next hunt cycle.
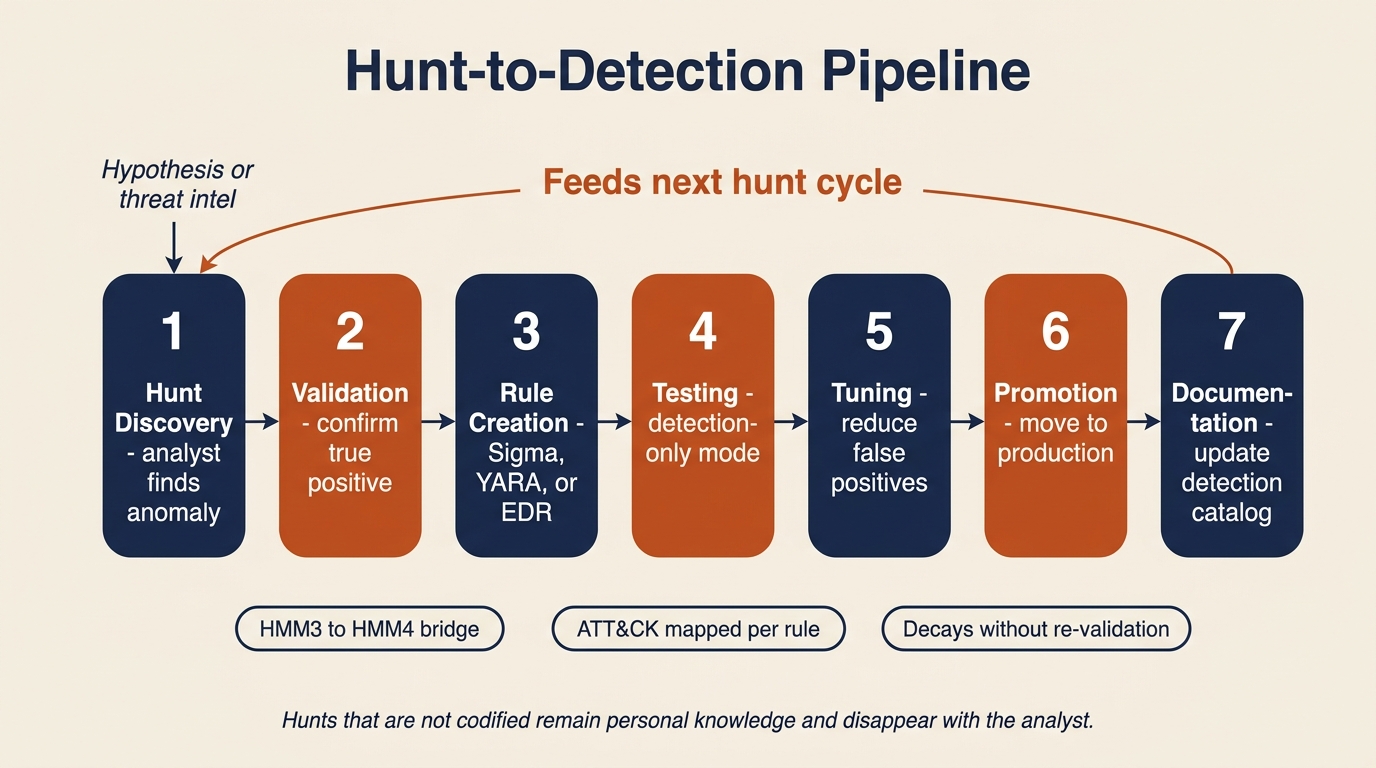
Figure 14.7: The hunt-to-detection pipeline. Each step is explicit and documented; the feedback arrow is what converts a one-time hunt finding into a permanent, continuously improving detection rule.
- Hunt discovery. An analyst finds a behavioral indicator during a proactive hunt. A scheduled task created at 3 a.m. on a server that has no business creating scheduled tasks at all, for example.
- Validation. The analyst confirms that the finding is a true positive and not a false positive caused by legitimate activity. This often involves talking to the system owner.
- Rule creation. The finding is codified as a Sigma rule for the SIEM, a YARA rule for endpoint scanning, or a custom EDR detection, depending on the data domain.
- Testing. The rule is deployed in detection-only mode (alerting but not auto-responding) and monitored for false positive rate over a defined period, typically one to two weeks.
- Tuning. Thresholds, exclusions, and conditions are adjusted to reduce false positives while maintaining detection fidelity. A rule that fires twenty times a day for benign activity will be ignored within a week.
- Promotion. The rule moves to production with the appropriate response actions: alert, ticket creation, automated host isolation, or whatever the runbook specifies.
- Documentation. The detection catalog is updated with the new rule, its origin (which hunt produced it), its ATT&CK mapping, and its tuning history.
This pipeline is the mechanism that advances an organization from HMM3 (innovative hunting) to HMM4 (automated detection from hunt findings). Without it, hunt discoveries remain personal knowledge in an analyst's notebook and disappear when that analyst changes roles.
Continuous Validation
Detections decay. New applications get deployed, infrastructure migrates from on-premises to cloud, operating systems get upgraded, and EDR agents push silent updates. Any of these changes can break an existing detection rule, and the failure will not announce itself. The rule simply stops firing, and if no one was tracking its baseline alert volume, no one will notice for months.
Two practices keep decay in check. The first is scheduled re-validation: running the relevant Atomic Red Team tests against critical detections on a monthly or quarterly cadence to confirm they still fire. The second is detection drift monitoring: tracking the historical alert volume of each rule and investigating any rule whose volume drops to zero unexpectedly. A correlation rule that normally fires five times a week and suddenly fires zero times for two weeks should generate its own alert.
Continuous validation is part of the IR program maintenance cycle introduced in Chapter 6. It is how Preparation stays current with reality, and it is the work that turns a written IR plan into a verified one.
Putting It Together: A Threat Hunt Exercise
The organization's threat intelligence team publishes an internal advisory at 9:00 a.m. on a Tuesday. A supply chain compromise has been reported in a third-party IT monitoring tool that the organization deployed across its server estate eighteen months ago. The advisory includes IOCs (two C2 domains and three file hashes) and TTPs: the attacker uses scheduled tasks for persistence, encoded PowerShell for execution, and DNS tunneling for exfiltration. The hunt team is asked to determine whether the organization has been affected.
Step 1: Hypothesis formation. The lead hunter writes the hypothesis in the hunt journal:
If our environment was compromised through this supply chain attack, we would expect to see (a) DNS queries to the C2 domains in our DNS logs, (b) the malicious file hashes on endpoints running the monitoring tool, (c) new scheduled tasks created on those endpoints in the last 30 days, and (d) anomalous DNS query patterns consistent with DNS tunneling.
Step 2: Data source identification. The team enumerates what is needed and confirms it is available. DNS query logs are retained for ninety days in the SIEM. EDR process and file telemetry covers all monitoring tool servers. Windows Event ID 4698 (scheduled task creation) is forwarded to the SIEM. Zeek logs are available for RITA analysis on the egress link.
Step 3: Hunt execution. The team runs four queries in parallel.
- DNS log search for the two C2 domains across ninety days returns no matches. Documented as a null result.
- YARA scan for the three file hashes on the monitoring tool servers returns no matches. Documented as a null result.
- Scheduled task audit on monitoring tool servers using Event ID 4698 over the last thirty days returns one anomaly. A scheduled task was created twelve days ago on one server, running an encoded PowerShell script. The task name does not match the standard naming convention used by the deployment automation, and the creating account is the local SYSTEM account rather than the service account that normally manages the tool.
- RITA beacon analysis on the same server's outbound traffic returns one beacon candidate. The server is communicating with a domain not in the IOC list, on a roughly six-hour interval with low jitter, to a domain registered fourteen days ago.
Step 4: Findings and escalation. The hunt found one indicator that was not in the original IOC list: a likely compromised server with a newly created scheduled task and a suspected C2 beacon to a previously unknown domain. The finding is escalated to the IR team for formal investigation, which moves the work back into the IR lifecycle at the Analysis phase covered in Chapter 8.
Step 5: Detection improvement. Regardless of whether the finding turns out to be a true positive after deep analysis, the hunt revealed something the SOC did not know: scheduled task creation on monitoring tool servers was not generating any SIEM alert at all. A new Sigma rule is drafted to alert on scheduled task creation by non-service accounts on the monitoring tool server group, deployed in detection-only mode for two weeks of tuning, and then promoted to production. The rule is logged in the detection catalog with its origin (Hunt 2026-04-14, supply chain advisory) and its ATT&CK mapping (T1053.005 Scheduled Task/Job).
Analyst Perspective
This scenario demonstrates the full loop. A threat intelligence report (input) triggered a hypothesis-driven hunt (process) that found an anomaly the SIEM had been silently ignoring (finding) and produced a new permanent detection rule (output). The new rule feeds back into the detection stack from Chapter 7, which improves Preparation from Chapter 6 for the next incident. That is the continuous improvement cycle that separates a mature IR program from one that simply reacts to whatever happens to set off an alarm.
Chapter Summary
Threat hunting is the discipline that moves security operations from reactive (waiting for alerts) to proactive (searching for what was missed). It occupies the boundary between Left of Boom and Right of Boom, using reactive data for proactive purposes.
- The Threat Hunting Maturity Model (HMM0 through HMM4) provides a framework for assessing an organization's hunting capability. Most organizations operate at HMM0 or HMM1; the realistic goal is to build toward HMM3 and HMM4.
- Hunting requires data. The logging, telemetry, and retention decisions made during Preparation in Chapter 6 determine what is available to hunt. You cannot find what you did not record.
- Two complementary approaches drive the work: hypothesis-driven hunting (behavioral patterns mapped to ATT&CK) and intelligence-driven hunting (specific IOCs from threat reports). Both are necessary, and neither replaces the other.
- Four tool categories cover the hunting landscape: YARA for file patterns, Sigma for log patterns, RITA for network beacons, and frequency stacking for statistical outliers.
- Adversary emulation, particularly through Atomic Red Team, validates that detections actually work. Without validation, detection coverage is an assumption, not a fact.
- The Purple Team loop and the Hunt-to-Detection Pipeline convert hunt discoveries into automated detections, advancing the organization from reactive operations to continuous improvement.
This chapter completes the cycle that Chapter 1 introduced. Risk management and planning (Chapters 1 through 4) establish the foundation. The IR lifecycle (Chapters 5 through 11) provides the response framework. Applied playbooks for ransomware (Chapter 12) and social engineering and insider threats (Chapter 13) tailor that framework to specific threat classes. Threat hunting (Chapter 14) finds what the framework missed and feeds the improvements back into the foundation. The cycle never ends. With each turn, the organization gets harder to compromise, faster to detect, and quicker to recover. That is the work of incident response and disaster recovery, and it is now your work to carry forward.