CH4: Passive and Active Reconnaissance
Introduction
Before you scan a network or attempt an exploit, you gather intelligence. Reconnaissance is detective work: finding public information about the target, understanding its network topology, and identifying systems and services that might be vulnerable. This chapter focuses on passive reconnaissance and the transition to active host discovery.
Passive reconnaissance uses publicly available data: search engine results, Domain Name System (DNS) records, social media, code repositories, certificate logs, cached web pages, and breach databases. You are not touching the target; you are mining public sources for intelligence. Active reconnaissance begins when you send traffic toward the target through port scanning, zone transfer attempts, or banner grabbing. This chapter covers passive methods first, then introduces the active techniques that mark the boundary between reconnaissance and scanning.
Section 4.1 draws the line between passive and active work, because that distinction governs every choice that follows. Section 4.2 then opens the course's hands-on toolkit, introducing nine command-line and web-based tools by name before any of them appears in a worked example. Each tool gets a short profile: what it does, how you run it, where it came from, and its practical use for a penetration tester. The goal is familiarity, not mastery. When dig shows up in the DNS section or Nmap shows up in the scanning section, you will already know what you are looking at.
By the end, you will understand how to build a picture of a target using open-source intelligence, anticipate network topology, identify systems before they are formally scanned, and know which tool to reach for at each stage. You will also understand the operational security tradeoffs between passive and active methods.
Learning Objectives
After completing this chapter, you will be able to:
- Distinguish between passive and active reconnaissance and explain the operational security implications of each.
- Identify the purpose, platform, and basic invocation of the core reconnaissance toolkit: nslookup, dig, whois, Shodan, Recon-ng, tcpdump, Netcat, ping, and Nmap.
- Perform open-source intelligence gathering using search engines, social media, code repositories, breach databases, and archived pages.
- Conduct DNS and registration reconnaissance using forward and reverse lookups, zone transfer attempts, certificate transparency logs, and registration data queries.
- Apply passive discovery techniques (traffic analysis, banner grabbing) and active discovery methods (ping sweeps, port scanning, service and operating system detection) to map systems before exploitation.
4.1 Passive and Active Reconnaissance
Passive reconnaissance gathers information from public sources without sending traffic directly at the target. No packets reach the target's systems. You are observing, not probing.
Active reconnaissance sends traffic directly to the target: port scans, zone transfer attempts, banner grabs. The target's systems log your activity. You appear in firewall logs, web server logs, and intrusion detection alerts.
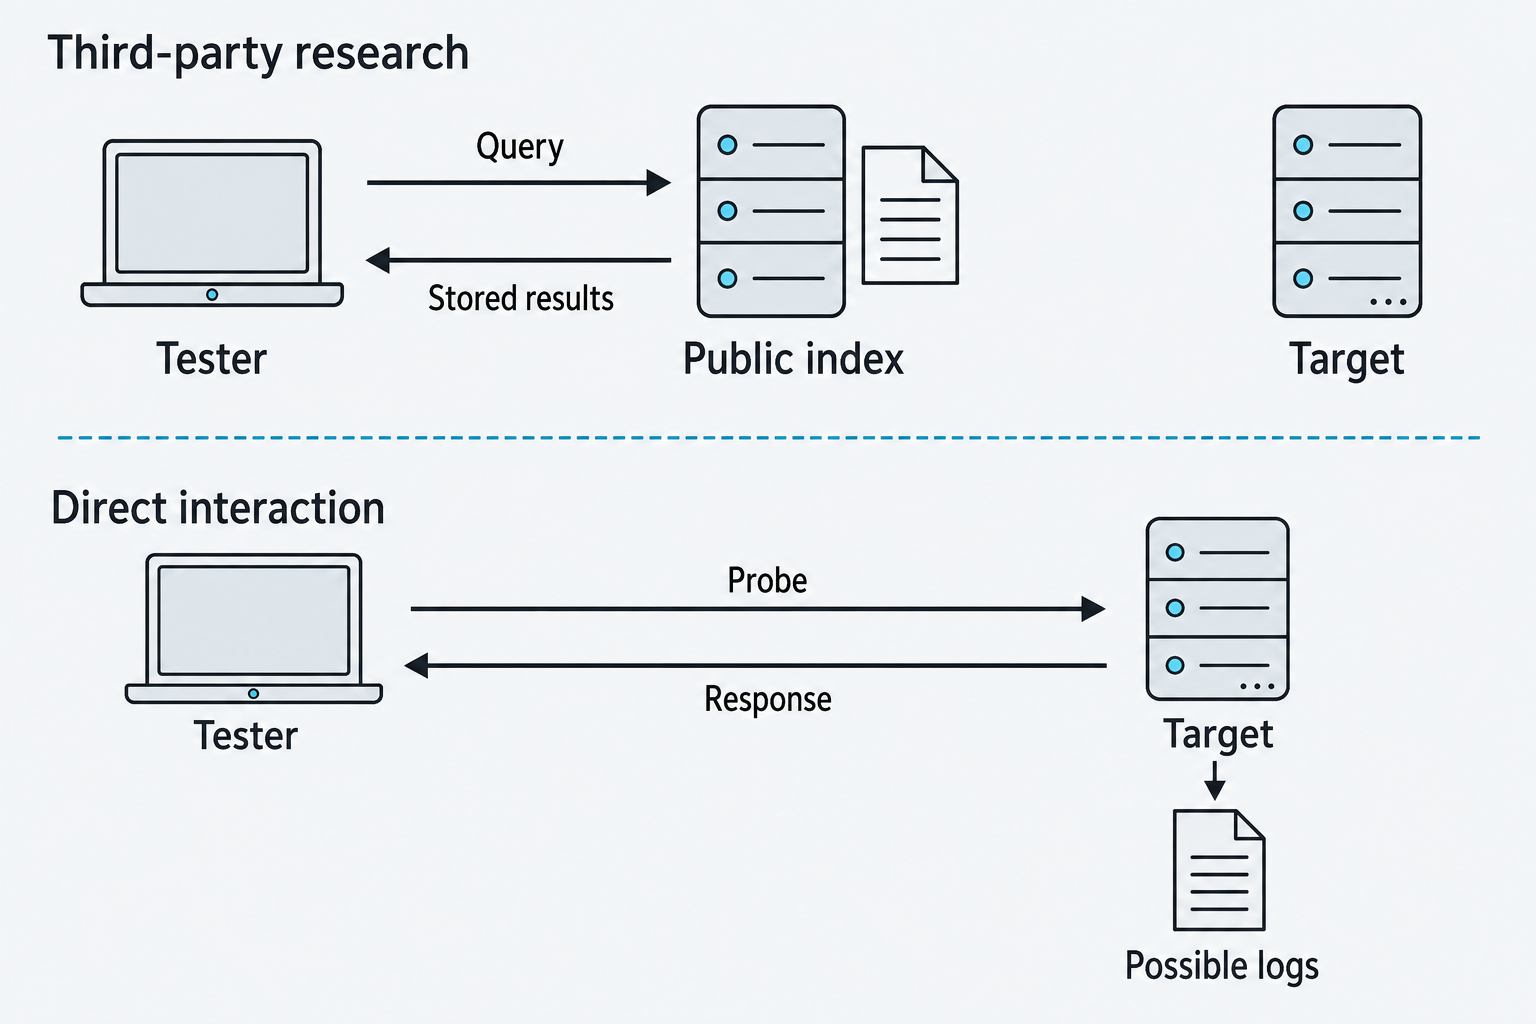
Figure 4.1: Third-party research retrieves stored information, while direct interaction sends traffic to the target.
Text description for Figure 4.1
The upper row shows a query to a public index and stored results returning to the tester. The target has no connection to this exchange. The lower row sends a probe to the target and receives a response, with possible target-side logs. The distinction concerns the traffic path shown. Third parties may log searches, and opening target-hosted content can create direct traffic.
Operational Security
Operational security (OPSEC) is the practice of controlling what an observer can learn about you from the traces your own activity leaves behind. The term comes from military planning, where the concern was that an adversary could assemble individually harmless observations, such as increased vehicle traffic and cancelled leave, into knowledge of an upcoming operation.
For a penetration tester, OPSEC is the discipline of managing your own detectability. Every action you take against a target sits somewhere on a scale from invisible to unmistakable, and OPSEC is the deliberate choice of where on that scale to operate. Practicing it means asking three questions before every action:
- What trace does this leave? A log entry, an alert, an entry in a search engine's records, a query the target's own nameserver can see.
- Who can see that trace, and when? A firewall log nobody reads for six months is not the same exposure as a monitoring system that pages an analyst in real time.
- What does the trace tell them? That someone scanned them, or that a specific address scanned these specific hosts in this specific order?
OPSEC matters to reconnaissance for two reasons that pull in different directions.
The first is engagement realism. Part of what a client buys is an answer to the question "would we have noticed?" If you scan loudly from one address and their security team catches it, that is a genuine finding worth reporting. If you scan loudly and they do not notice, that is a more serious finding. Neither answer is available if you never generate detectable activity at all.
The second is preserving the test. In a black box engagement where only a small group knows testing is scheduled, being detected early can end the exercise. Defenders who spot you may block your address, patch the systems you were about to test, or trigger an incident response that consumes the client's week. Passive reconnaissance protects against this because it produces nothing for anyone to detect.
The engagement type usually settles the tension. In a black box or red team engagement, OPSEC is a primary constraint and you stay passive as long as the intelligence keeps coming. In a white box or gray box assessment where the client already knows the schedule, OPSEC matters less, and burning days on stealth you were not asked for is a poor use of the client's budget.
Cost, Time, and Legality
Cost and time. Passive reconnaissance is slow. Reading search results, reviewing repositories, and working through archived pages takes days or weeks and does not parallelize well. Active reconnaissance is fast: a scan of a /24 address block finishes in minutes. You trade time for exposure.
Legality. Passive reconnaissance against genuinely public data is generally lawful. Reading a company's website, searching a public code repository, and querying registration databases are not intrusions. Active reconnaissance is less settled. Port scanning is not explicitly criminalized in most jurisdictions, though it has been treated as evidence of intent in prosecutions, and unauthorized scanning can breach terms of service or acceptable use agreements even where it breaks no statute. Your protection is the written authorization from Chapter 2. The statement of work and rules of engagement should name active scanning as permitted and name the systems it may touch.
The Continuum
Reconnaissance runs along a continuum of exposure:
- Pure passive. Search engines, published documents, social media, archived pages. Zero interaction with the target.
- Passive with third-party interaction. Registration data lookups, certificate transparency searches, Shodan queries. You touch someone else's servers, never the target's, and the target sees nothing.
- Low-touch active. Resolving the target's hostnames against their own nameservers, one connection to one service to read a banner. Technically traffic to the target, easily lost in the noise.
- Stealthy active. Slow scans spread over hours, limited port sets, traffic distributed across source addresses. Detectable by an attentive defender, invisible to most.
- Aggressive active. Full port scans at speed across every host in scope. Unmistakable in logs, and the fastest path to a complete picture.
Most engagements walk this ladder in order. Each rung buys better information at the cost of more exposure, and the rung you stop on is a decision the rules of engagement should already have made.
4.2 The Reconnaissance Toolkit
Nine tools carry most of the work in this chapter, and several of them return in every chapter that follows. This section introduces each one so that later examples land on familiar ground rather than introducing a tool and a technique at the same moment. Each profile notes where the tool sits on the passive-to-active continuum from section 4.1, because that placement decides when in an engagement you are allowed to run it.
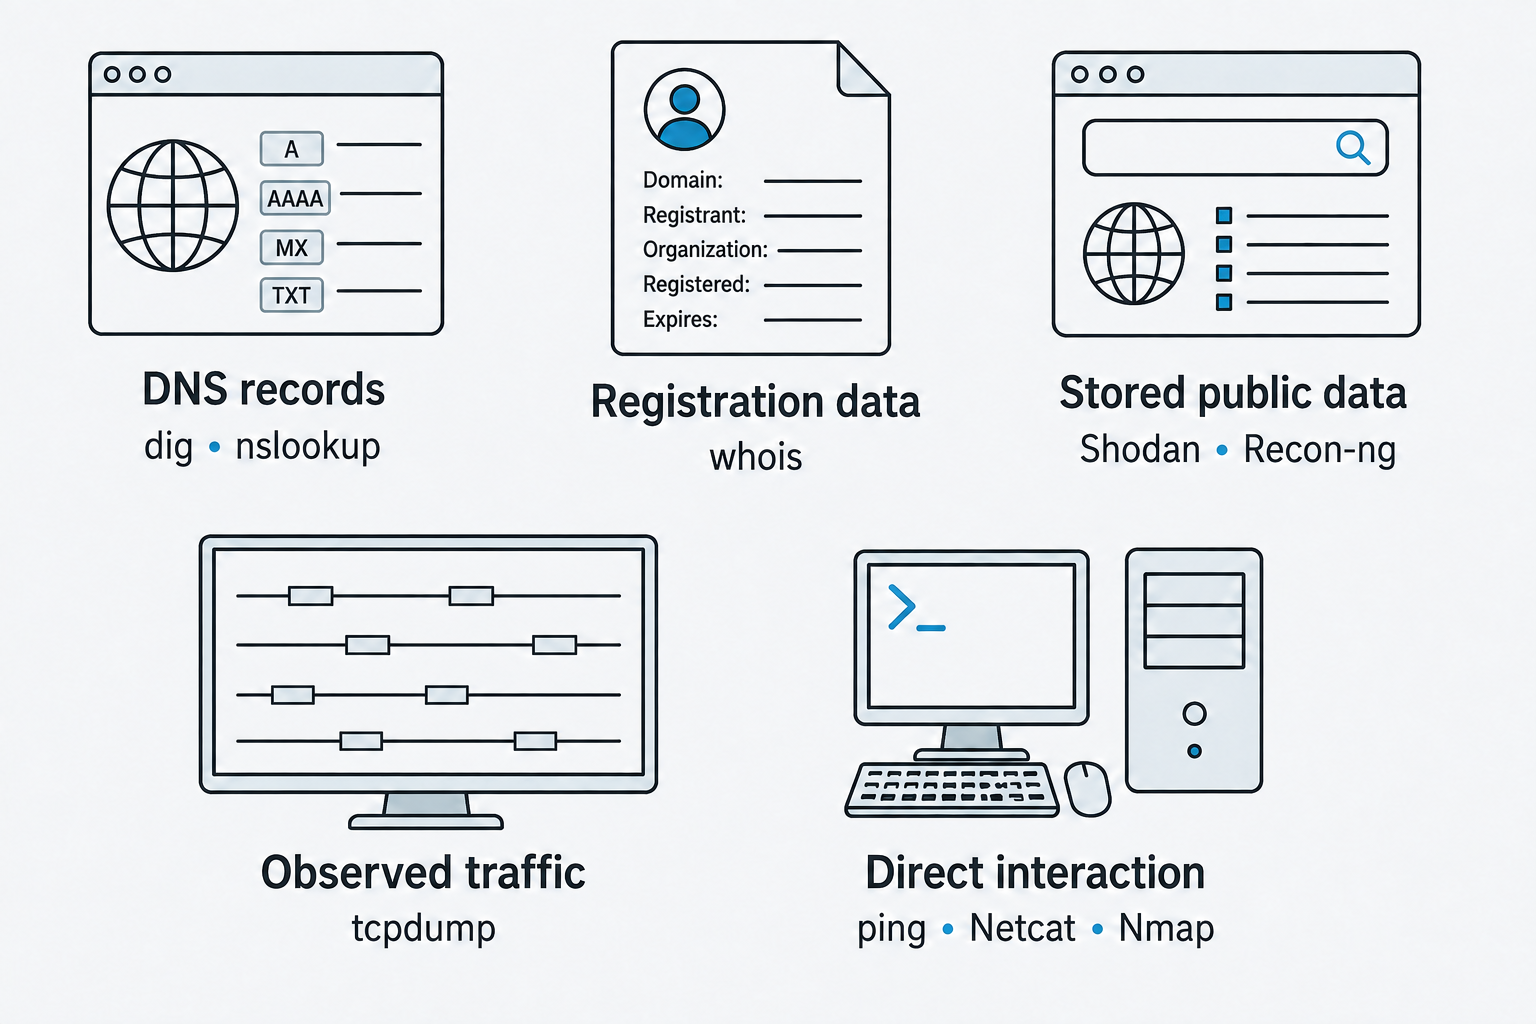
Figure 4.2: The core toolkit serves five reconnaissance jobs, from record lookup to direct service interaction.
Text description for Figure 4.2
DNS (Domain Name System) records pair with dig and nslookup. Registration data pairs with whois. Stored public data pairs with Shodan and Recon-ng. Observed traffic pairs with tcpdump. Direct interaction pairs with ping, Netcat, and Nmap. These are common roles rather than fixed passive or active classifications. Recon-ng behavior depends on the selected module, and DNS traffic depends on the server queried. Registration fields may be redacted.
Each profile answers four questions:
- What it does. The one-sentence job description.
- How you run it. Command line, graphical interface, or web service, and which operating systems it runs on.
- Where it came from. Enough history to explain why the tool behaves the way it does.
- Practical use: The specific reconnaissance job it performs on an engagement.
Analyst Perspective
Notice how old most of this software is. Ping was written in 1983, nslookup in 1986, Netcat in 1995, Nmap in 1997. These tools survived because they do one job well and produce output other programs can consume. A tester who knows the classics can work on any system they are dropped onto, including the locked-down jump host with no internet access where the shiny modern tooling was never installed.
nslookup
What it does. Nslookup queries DNS servers for records: which address a name resolves to, which mail servers accept a domain's mail, which nameservers are authoritative.
How you run it. Command line, in two modes. Single-command mode takes the query as arguments (nslookup example.com). Interactive mode starts a session with a > prompt where you set options and issue repeated queries. It is built into Windows and available on Linux through the bind9-dnsutils package on Debian and Ubuntu, or bind-utils on Red Hat and Fedora.
Where it came from. Andrew Cherenson wrote nslookup as a class project at the University of California, Berkeley, in 1986, and it shipped as part of the Berkeley Internet Name Domain (BIND) name server suite. The Internet Systems Consortium (ISC) once planned to retire it in favor of dig and host, then reversed that decision with BIND 9.3 in 2004. It ships fully supported in current BIND releases.
Practical use: Nslookup is the DNS tool that is already installed on a Windows host, which matters more than it sounds. During an internal engagement you often work from a Windows workstation you do not control and cannot install software on. Nslookup is there.
Zone transfers and the platform split
Nslookup's ls subcommand attempts a zone transfer, and it works on Windows. On Linux and Berkeley Software Distribution (BSD) systems it does not: the BIND 9 manual page states plainly that ls "is not implemented." Any tutorial showing nslookup -type=AXFR on Linux is wrong. Use dig AXFR there instead. This is covered again in section 4.4.
dig
What it does. Dig performs DNS lookups and prints the full response, including the query section, answer section, authority records, flags, and timing. It is the more capable of the two DNS clients and the one you reach for when you need to see exactly what the server said.
How you run it. Command line only. It comes from the same packages as nslookup (bind9-dnsutils on Debian and Ubuntu, bind-utils on Red Hat and Fedora). It is not installed on Windows by default; Windows users install the ISC BIND utilities, use a package manager, or work inside the Windows Subsystem for Linux. Verify presence on macOS with which dig before relying on it.
Flags worth knowing immediately:
dig example.comreturns the full verbose response.dig +short example.comreturns just the answer values, which is what you want inside a script.dig +noall +answer example.comreturns the answer section only, with name, time to live, class, type, and value.dig @8.8.8.8 example.comsends the query to a specific nameserver instead of your configured resolver.dig -x 192.0.2.1performs a reverse lookup.
Where it came from. Steve Hotz wrote the original, and it was folded into BIND around 1990. Michael Sawyer later rewrote it. ISC maintains it today. The old expansion "Domain Information Groper" was dropped from the manual page in 2017; the tool is now simply called dig.
Practical use: Dig gives you the whole answer rather than a summary, which is what you need when you are testing whether a nameserver is misconfigured. Querying an organization's own nameserver directly with @ bypasses your local resolver's cache and tells you what that server will hand to anyone who asks.
whois
What it does. Whois queries registration databases for ownership information about a domain, an address block, or an autonomous system number.
How you run it. Command line on Linux and macOS (the whois package on Debian and Ubuntu). Windows has no native whois; the standard tool is Microsoft's Sysinternals Whois utility, a separate download. Every registry also offers a web lookup.
Where it came from. The protocol is defined by Request for Comments (RFC) 3912 (2004), which obsoleted RFC 954 and RFC 812. It is about as simple as a protocol can be: connect to Transmission Control Protocol (TCP) port 43, send a text query terminated with a carriage return and line feed, read text back until the server closes the connection. RFC 3912 says outright that the protocol "lacks mechanisms for access control, integrity, and confidentiality."
Practical use: Two queries matter to a tester. whois example.com returns the registrar, the nameservers, and the creation and expiration dates. whois 192.0.2.1 returns the address block and the organization it is allocated to, which is how you turn one known address into an entire range worth scanning. whois AS64496 returns the address blocks registered to an autonomous system number, which is how you find all the address space an organization announces.
Registration data has changed, and most tutorials have not caught up
Two shifts have reshaped what a lookup actually returns. First, privacy regulation drove widespread redaction of registrant contact fields. Under the Internet Corporation for Assigned Names and Numbers (ICANN) Registration Data Policy, in effect since 21 August 2025, registrant name, street address, phone, and email are commonly redacted or replaced with an anonymized relay address or a web contact form, while country, state or province, registrar, nameservers, status codes, and dates are typically still published. Second, ICANN sunset WHOIS as the definitive source for generic top-level domain registration data on 28 January 2025, replacing it with the Registration Data Access Protocol (RDAP), a structured JavaScript Object Notation (JSON) service reachable through https://lookup.icann.org. Port 43 whois still answers for many registries and for regional internet registry address data, but for a .com domain, RDAP is now the authoritative channel. Expect thinner output than a decade-old tutorial promises, and demonstrate both.
Shodan
What it does. Shodan is a search engine for internet-connected devices rather than web pages. It continuously scans the internet, records the banner each service returns, and lets you search that banner data.
How you run it. Primarily a web service at shodan.io. There is also a command-line client, installed with pip install -U --user shodan and authenticated with shodan init YOUR_API_KEY. Core commands are shodan host 8.8.8.8 for a single address, shodan search nginx for a query, and shodan count port:22 for a result count without spending credits.
Where it came from. John Matherly launched Shodan on 23 November 2009. Its crawler does not walk address ranges in order; it picks a random address and a random port from a known-ports list, grabs a banner, and repeats, around the clock. The design target is a full random pass of the internet roughly once a week.
Practical use: Shodan finds the systems an organization forgot it exposed. A staging server, a monitoring dashboard, a network camera, a database that was supposed to be behind a firewall. Because Shodan already did the scanning, querying it costs you nothing in traffic to the target and produces no entry in the target's logs. Useful filters include org:, hostname:, net:, port:, product:, ssl:, and http.title:.
Access matters for planning a lab. The free tier covers the web search interface and a free application programming interface (API) key. The vuln: filter, which lists devices matching known vulnerabilities, is restricted to paid tiers. A separate no-account service called InternetDB returns open ports, hostnames, and known vulnerability identifiers for a single address with no key at all.
Shodan data is a snapshot, not live truth
Search results reflect the most recent banner from the past 30 days. A port Shodan lists may have closed weeks ago, and a port it omits may have opened yesterday. Treat every Shodan result as a lead to confirm, never as a finding to report.
Recon-ng
What it does. Recon-ng is a framework that automates open-source intelligence collection. Rather than running a dozen tools by hand and reconciling the output, you load modules that each query one data source and write results into a shared database.
How you run it. Command line, written in Python, preinstalled on Kali Linux. There is no Debian or Ubuntu package; elsewhere you install from source with git clone https://github.com/lanmaster53/recon-ng.git and then pip install -r REQUIREMENTS inside the cloned directory. It presents a nested prompt that tells you where you are: [recon-ng][workspace] > at the framework level and [recon-ng][workspace][module] > once a module is loaded.
Where it came from. Tim Tomes wrote it, and it deliberately borrows the look and feel of the Metasploit Framework so that testers already comfortable there find it familiar. Version 5 rewrote it for Python 3 and moved the modules out of the main program into a separate marketplace, so a fresh install ships with no modules at all and you install the ones you need.
Practical use: Recon-ng turns reconnaissance into a repeatable, documented process. Results land in a workspace database organized into tables such as hosts, contacts, domains, netblocks, ports, and credentials, which means your evidence for a finding is a database record rather than a screenshot you took at three in the morning. Roughly half the available modules need no API key at all.
The command that every outdated tutorial gets wrong
In version 4 you loaded a module with use. In version 5 that command does not exist, and typing it returns [!] Invalid command: use. The correct command is modules load <path>. Published guides, including some official-looking tool pages, still show the old syntax. Section 4.5 walks the current sequence end to end.
tcpdump
What it does. Tcpdump captures packets off a network interface and prints or saves them. It is the reference command-line packet analyzer.
How you run it. Command line, standard on Linux and macOS. Capturing requires elevated privileges: root, or the CAP_NET_RAW capability on Linux, which is the cleaner approach. Windows has no official tcpdump port. The old WinDump port depends on WinPcap, which its maintainers discontinued in 2018. On Windows today the capture driver is Npcap, from the Nmap project, and the practical equivalents are Wireshark's tshark and dumpcap, or running tcpdump inside the Windows Subsystem for Linux.
Core flags:
tcpdump -Dlists the interfaces available to capture on.tcpdump -i eth0captures on a named interface.tcpdump -nskips name resolution, which keeps your capture from generating its own DNS traffic.tcpdump -c 100stops after 100 packets.tcpdump -w capture.pcapwrites a capture file;-r capture.pcapreads one back.tcpdump -Aprints payloads as text;-Xprints hex and text together.
Where it came from. Van Jacobson, Craig Leres, and Steven McCanne wrote it at Lawrence Berkeley National Laboratory. The same group produced libpcap, the capture library underneath it, and the Berkeley Packet Filter architecture that gives tcpdump its filter syntax. That filter language, unchanged for decades, is the same one Wireshark accepts as a capture filter.
Practical use: On an internal engagement, a few minutes of capture on a segment tells you which protocols are in use, which hosts talk to which, and whether anything is still sending credentials in the clear. Legacy protocols such as File Transfer Protocol (FTP), Telnet, and unencrypted mail retrieval hand over usernames and passwords to anyone listening.
Capturing is not automatically in scope
Packet capture collects traffic belonging to people who are not your target: other users' sessions, internal business communications, personal browsing. Even on an authorized engagement, capture must be explicitly permitted in the rules of engagement, and what you may retain from it must be written down. When in doubt, capture headers rather than payloads.
Netcat
What it does. Netcat opens a raw TCP or User Datagram Protocol (UDP) connection and connects it to standard input and output. That is the entire feature set, and it is why the tool is called the network Swiss Army knife.
How you run it. Command line as nc, on Linux and macOS. On Windows you get Ncat, which ships as part of the Nmap installer. For reconnaissance the useful flags are -v for verbose output, -w to set a timeout, and -z to check whether a port is open without sending data.
Where it came from. A developer known as Hobbit released the original in 1995 through Avian Research, reaching version 1.10 in 1996. That lineage matters because several incompatible descendants are in circulation today: the original, now packaged as netcat-traditional; a rewrite maintained by OpenBSD; Apple's fork of the OpenBSD version; and Ncat from the Nmap project.
Practical use: Netcat is how you talk to a service by hand. Point it at a port and read what comes back, and you have performed banner grabbing without any dedicated tool. It is also the fastest way to confirm that a port a scanner reported is genuinely reachable and speaking the protocol you expect.
Which netcat is on this machine?
The variants take different flags. The -e flag, which attaches a program to the connection and appears in nearly every reverse-shell tutorial, exists in netcat-traditional and Ncat but not in the OpenBSD version, which errors with nc: invalid option -- 'e'. Worse, on OpenBSD itself the letters -c and -e exist but control Transport Layer Security settings, so the same flag silently does something unrelated. Run nc -h and read the first line before you trust any command you copied. On a system with alternatives configured, readlink -f $(which nc) tells you which binary you actually have.
ping
What it does. Ping tests whether a host is reachable and measures the round-trip time to it. It sends an Internet Control Message Protocol (ICMP) Echo Request (type 8) and waits for an Echo Reply (type 0), as defined in RFC 792.
How you run it. Command line, and it is preinstalled on Windows, macOS, and every mainstream Linux distribution. The flags are one of the most common cross-platform traps in the whole toolkit:
| Purpose | Windows | Linux | macOS/BSD |
|---|---|---|---|
| Number of packets | -n 4 |
-c 4 |
-c 4 |
| Payload size in bytes | -l 32 |
-s 56 |
-s 56 |
| Run continuously | -t |
default behavior | default behavior |
| Per-reply timeout | -w (milliseconds) |
-W (seconds) |
-W (milliseconds) |
Where it came from. Mike Muuss wrote ping in December 1983 at the U.S. Army Ballistic Research Laboratory, and named it after the sound sonar makes. He described it as "a little thousand-line hack that I wrote in an evening."
Practical use: Ping is the simplest possible host discovery: does anything answer at this address? Scripted across a range, it becomes a ping sweep, the fastest way to turn a block of addresses into a list of live hosts. The important caveat is that silence proves nothing. Plenty of firewalls drop ICMP entirely, so a host that never answers a ping may be running a dozen services.
The -t trap
On Windows, ping -t pings forever until you press Ctrl+C. On macOS and BSD, -t sets an overall timeout in seconds. The same letter does opposite things, and students who memorize one platform's flags produce broken commands on the other.
Nmap
What it does. Nmap discovers hosts on a network, determines which ports are open, identifies the service and version behind each open port, guesses the operating system, and runs scripted checks against what it finds. It is the single most important tool in this course.
How you run it. Command line on Linux, macOS, and Windows, where it requires the Npcap driver and ships with the optional Zenmap graphical front end. Many scan types send raw packets and therefore require root or administrator privileges. Nmap chooses its default scan accordingly: a privileged user gets a SYN scan (-sS), an unprivileged user gets a connect scan (-sT).
The flags to recognize on sight:
| Flag | What it does |
|---|---|
-sn |
Host discovery only, no port scan. This is a ping sweep. Formerly -sP. |
-sS |
TCP SYN scan. Sends SYN, reads the reply, never completes the handshake. Needs privileges. |
-sT |
TCP connect scan. Completes the full handshake through the operating system. No privileges needed, more likely to be logged. |
-sU |
UDP scan. Slow, because targets rate-limit the error responses it depends on. |
-sV |
Service and version detection on open ports. |
-O |
Operating system detection by fingerprinting stack behavior. |
-A |
Aggressive: exactly -O, -sV, default scripts, and traceroute together. |
-p- |
Scan all 65,535 ports instead of the default 1,000. |
-Pn |
Skip host discovery and treat every target as up. |
-T0 to -T5 |
Timing, from paranoid to insane. -T3 is the default. |
--script |
Run Nmap Scripting Engine scripts by name, category, or expression. |
-oA base |
Write normal, Extensible Markup Language (XML), and grepable output files at once. |
Where it came from. Gordon Lyon, who publishes under the handle Fyodor, released Nmap on 1 September 1997 in issue 51 of Phrack magazine, as roughly two thousand lines of C. It has been developed continuously ever since. It is no longer plain GPLv2: current versions ship under the Nmap Public Source License, which is GPLv2-derived with added restrictions on bundling Nmap into proprietary products.
Practical use: Nmap is where reconnaissance becomes scanning. Every chapter after this one assumes you can produce a list of live hosts, open ports, and service versions, and Nmap is how that list gets made. Two behaviors are worth memorizing now. By default it scans the 1,000 most commonly used ports for each protocol, ranked by observed frequency, not ports 1 through 1000; if you need everything, you must ask for -p-. And the Nmap Scripting Engine, written in Lua, extends the tool well past port scanning into version probing, vulnerability checks, and light exploitation, through hundreds of scripts organized by category.
Nmap is loud by default
A default Nmap run against a range is unmistakable in firewall and intrusion detection logs. That is fine on an authorized engagement and a problem on a stealth-focused one. Scanning is also the first activity in this chapter that clearly requires written authorization. Confirm the target is in scope before you press Enter.
Toolkit at a Glance
| Tool | Category | Interface | Preinstalled on | Primary reconnaissance job |
|---|---|---|---|---|
| ping | Host discovery | Command line | Windows, macOS, Linux | Is this address alive? |
| nslookup | DNS | Command line | Windows; package install on Linux | Quick DNS lookups from any host |
| dig | DNS | Command line | Package install on Linux; usually macOS | Full DNS responses, zone transfer attempts |
| whois | Registration data | Command line, web | macOS; package install on Linux | Domain owner, address blocks, autonomous systems |
| Shodan | Internet scan data | Web, command line | Neither (web service) | Exposed services without touching the target |
| Recon-ng | Open-source intelligence framework | Command line | Kali Linux | Automating and recording collection |
| tcpdump | Packet capture | Command line | macOS; package install on most Linux | Protocols, hosts, and cleartext credentials on a segment |
| Netcat | Raw connections | Command line | macOS, most Linux | Banner grabbing and manual service interaction |
| Nmap | Scanning | Command line, graphical user interface (GUI) | Neither (install required) | Live hosts, open ports, service versions, operating systems |
4.3 Open-Source Intelligence
Open-source intelligence (OSINT) is intelligence gathered from publicly available sources. For a penetration tester it supplies the context that makes later technical work efficient: what the organization does, who works there, what technology they run, and what they have accidentally published.
Search Engine Operators
Search engines support operators that narrow results to specific sites, file types, or content patterns. Using them for reconnaissance is commonly called Google dorking, though the operators work across most major search engines.
Operators worth knowing:
site:company.comrestricts results to one domain, and often reveals subdomains you did not know existed.site:company.com filetype:pdffinds published documents. Manuals and procedure documents frequently contain internal hostnames, address ranges, and software versions.inurl:adminfinds pages with a term in the address, a common way to locate administrative interfaces.intitle:"index of"finds directory listings that were never meant to be browsable.site:company.com -wwwexcludes the main site, surfacing everything else the search engine has indexed for the domain.
Combining operators is where the value is. site:company.com filetype:xlsx looks for published spreadsheets. site:company.com inurl:vpn looks for remote access documentation. intitle:"Apache" site:company.com looks for default pages that leak software versions.
Analyst Perspective
Search reconnaissance rewards patience and produces uneven results. Most queries return nothing. Then one returns a vendor implementation document with the internal address scheme in an appendix, and you have saved a week. Budget real time for it early in an engagement, when you have the least information and the most to gain.
People and Employment Data
Employment-focused sources describe the organization's technology through the people it hires.
- Professional networking sites publish job listings that name technologies directly. A posting for a Kubernetes administrator establishes container infrastructure. Employee profiles establish team structure and seniority, and often name specific products in their skills sections.
- Code repositories are the highest-yield people-adjacent source. Developers commit credentials, internal addresses, and API keys by accident, sometimes in personal repositories rather than the organization's. Search the company name and known employee usernames.
- Company career and leadership pages establish office locations, department names, and the executive team, which supports social engineering when it is in scope.
- Employee review sites occasionally describe security practices and internal systems in unflattering detail.
Archived Pages
Web archives keep historical snapshots of sites. Old versions expose things the current site does not: a since-removed staff directory, a configuration file that was briefly published, a footer naming the content management system and its version.
The reconnaissance value is in the delta. A site running a current, patched web server today may show a much older version in a snapshot from two years ago. That does not prove the old version is still running, but it tells you what the organization's patching cadence looks like, and internal systems often lag the public site considerably.
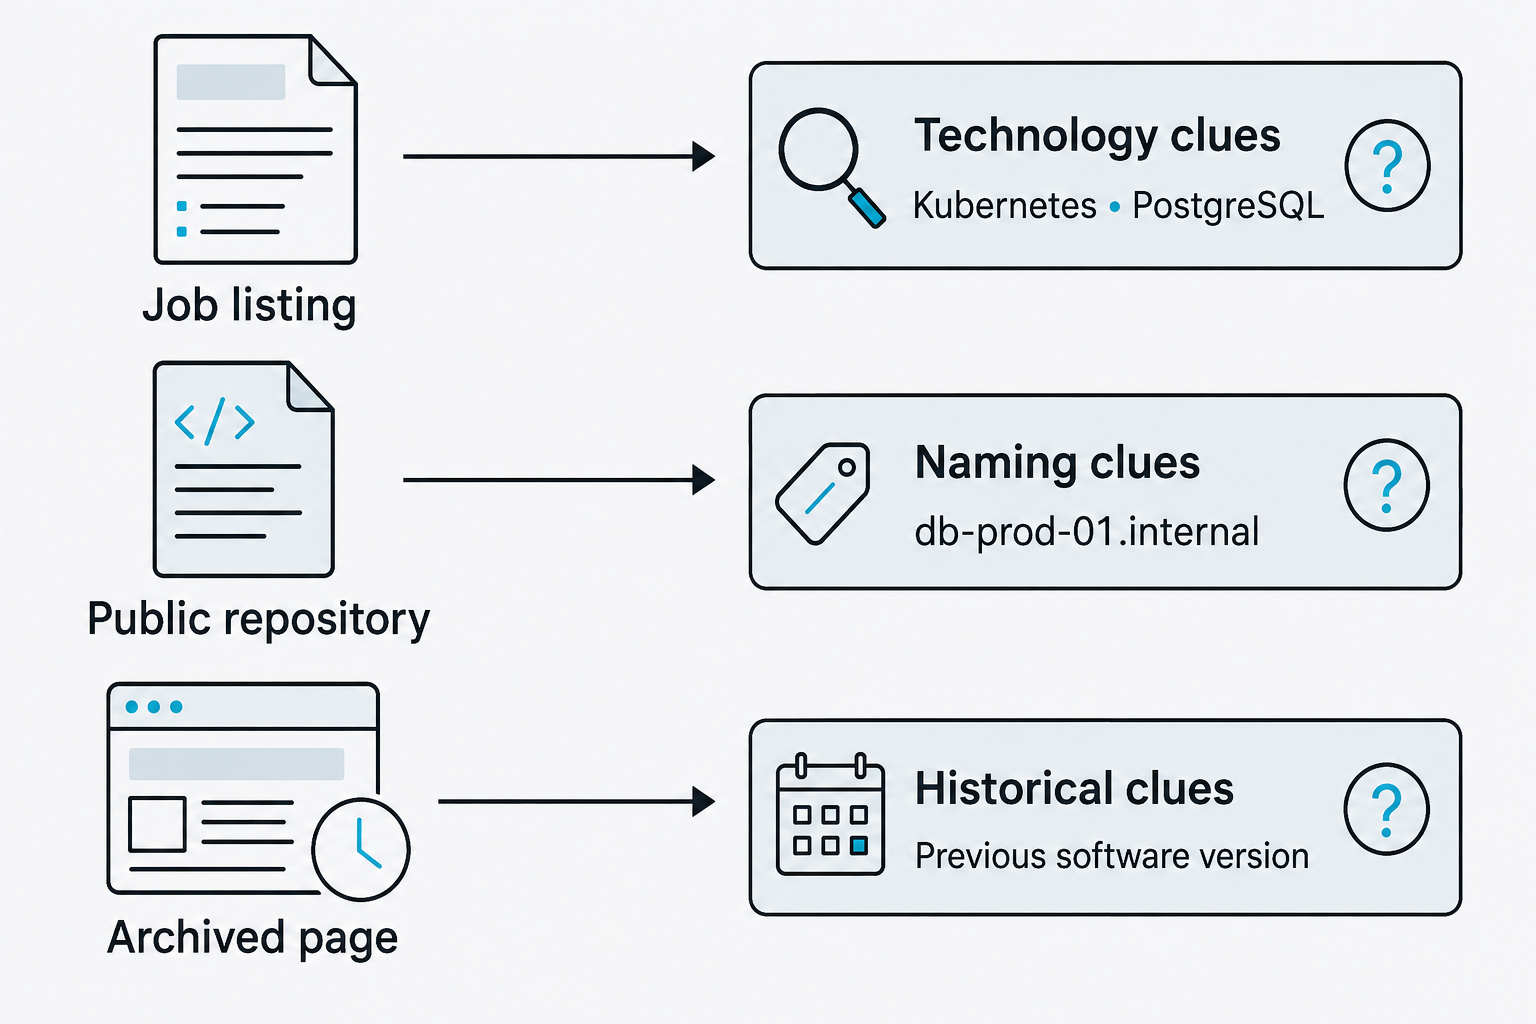
Figure 4.3: Public sources provide technology, naming, and historical clues for later verification.
Text description for Figure 4.3
A job listing names Kubernetes and PostgreSQL as technology clues. A public repository mentions db-prod-01.internal as a naming clue. An archived page records a previous software version as a historical clue. Question marks identify uncertainty. These fictional examples suggest investigation but do not establish current deployment, host function, or vulnerability.
Breach Data
If an organization or its employees appear in a publicly known breach, credential data may be available. Services that index breach data let you check whether an email address appears in a known incident.
The reconnaissance value is pattern rather than access. Old credentials are usually stale. What they reveal is the organization's email address format, the password composition rules in force when the breach happened, and whether a particular employee reuses passwords across services.
Ethical boundary
Finding breached credentials and using them are different acts. Testing a system with credentials obtained from a breach requires explicit written authorization, and many engagements prohibit it outright. Absent that authorization, document that the credentials exist and are exposed, which is itself a reportable finding, and stop there.
4.4 DNS and Registration Reconnaissance
DNS is a public directory the target is obliged to keep answering. It maps names to addresses, names mail servers, and frequently exposes organizational structure through hostnames alone.
Record Types
| Record | Maps | Reconnaissance value |
|---|---|---|
| A | Hostname to IPv4 address | The core name-to-address mapping |
| AAAA | Hostname to IPv6 address | IPv6 hosts are often less monitored than their IPv4 counterparts |
| MX | Domain to mail servers | Reveals whether mail is self-hosted or with a provider |
| NS | Domain to authoritative nameservers | Identifies who to query directly, and who hosts the DNS |
| CNAME | Alias to canonical name | Exposes third-party services through the names they point at |
| TXT | Arbitrary text | Holds mail authentication policy and service verification tokens, which name the vendors in use |
| SOA | Zone administrative data | Contains the primary nameserver and the zone's administrative contact |
Forward and Reverse Lookups
A forward lookup resolves a name to an address:
dig +short www.example.com
nslookup www.example.com
A reverse lookup resolves an address back to a name:
dig -x 192.0.2.1
nslookup 192.0.2.1
Reverse records are worth more than they look. Organizations name infrastructure descriptively, so a reverse lookup across a discovered range can hand you a labeled map: names containing vpn, db, mail, dev, or bak tell you what each host is for before you send a single scan packet. Reverse records also lag reality, so they sometimes name systems that were decommissioned or renamed but never cleaned up.
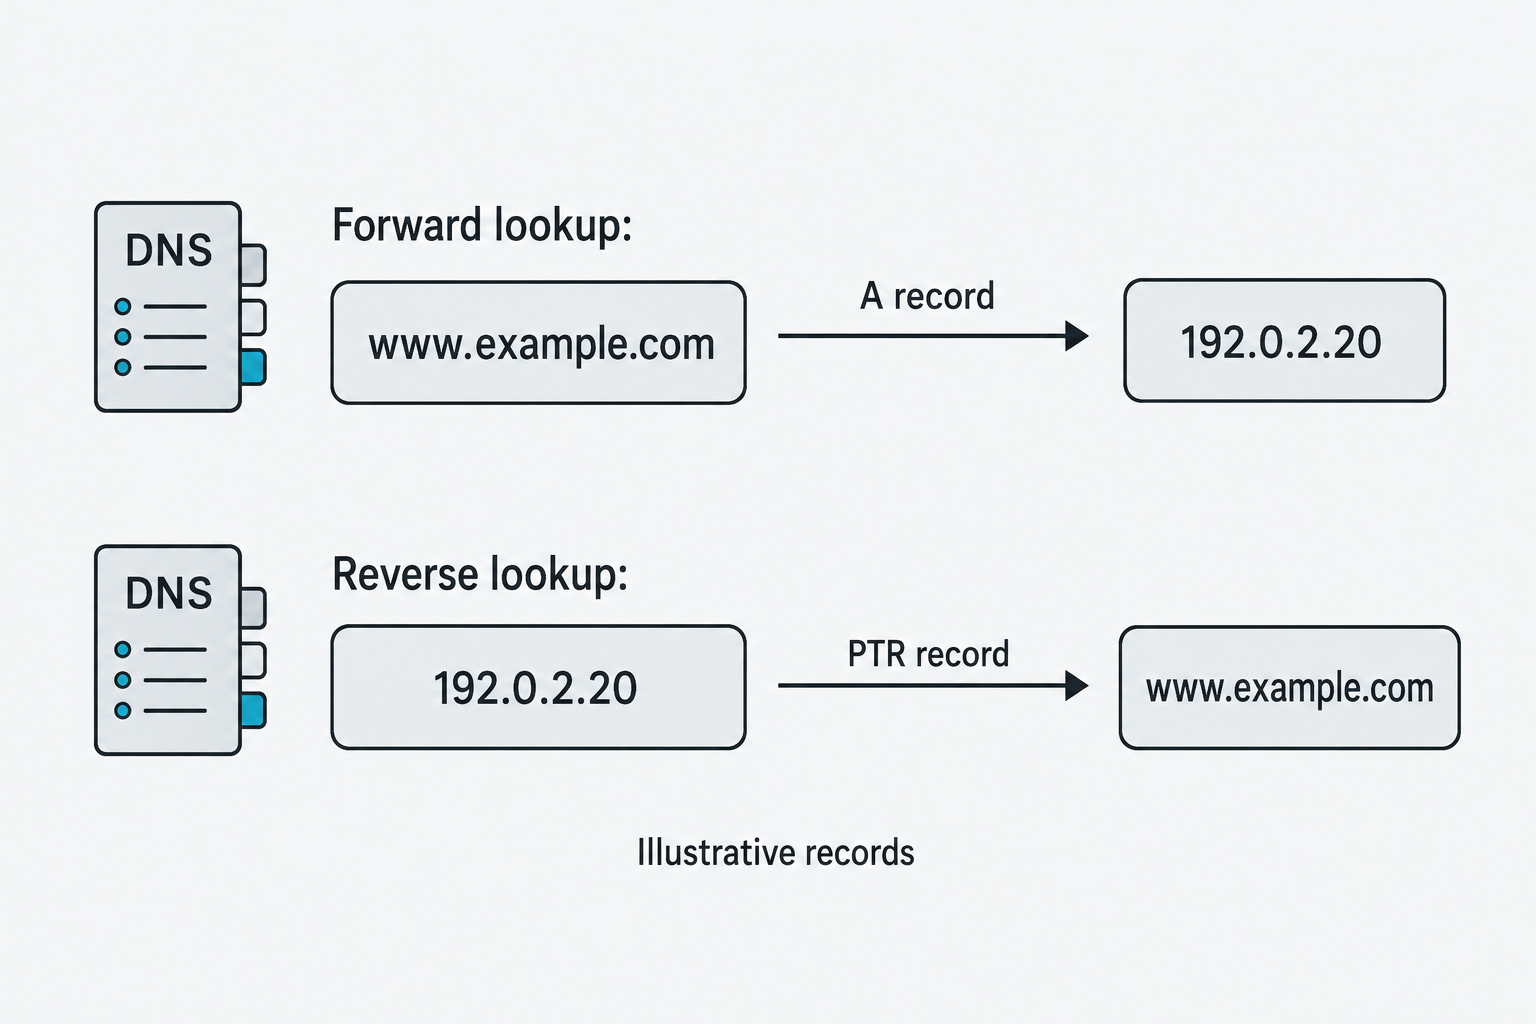
Figure 4.4: Forward and reverse DNS lookups query different record types.
Text description for Figure 4.4
The top row illustrates an A record, which maps a hostname to an IPv4 address. The lower row illustrates a PTR (pointer) record, used in reverse DNS to map an address to a name. These example records show matching values, but the two record sets are maintained separately and may be absent, stale, or inconsistent.
Zone Transfers
A zone transfer is the bulk replication mechanism DNS uses to copy a zone from a primary nameserver to its secondaries. The request type is AXFR. A nameserver should accept it only from named secondary servers. A misconfigured one accepts it from anyone, and hands over every record in the zone at once.
The current syntax:
dig @ns1.example.com example.com AXFR
A successful transfer returns the complete zone:
example.com.        3600    IN  SOA ns1.example.com. admin.example.com. 2026081201 7200 3600 1209600 3600
example.com.        3600    IN  NS  ns1.example.com.
example.com.        3600    IN  NS  ns2.example.com.
example.com.        3600    IN  A   192.0.2.1
www.example.com.    3600    IN  A   192.0.2.2
mail.example.com.   3600    IN  A   192.0.2.3
vpn.example.com.    3600    IN  A   192.0.2.4
api.example.com.    3600    IN  A   192.0.2.5
staging-api.example.com. 3600   IN  A   192.0.2.6
internal-db.example.com. 3600   IN  A   10.0.1.5
example.com.        3600    IN  SOA ns1.example.com. admin.example.com. 2026081201 7200 3600 1209600 3600
;; XFR size: 11 records (messages 1, bytes 320)
A zone transfer response opens and closes with the Start of Authority record, which is how the receiving server knows it got the whole zone.
Note the last line. A record pointing at a private address in a public zone tells you the internal addressing scheme, which is intelligence you would otherwise need internal access to obtain.
Successful anonymous zone transfers have become uncommon. Most organizations now use managed DNS providers that restrict transfers correctly by default. It remains worth one command per nameserver, because when it does work it collapses days of subdomain enumeration into a single query.
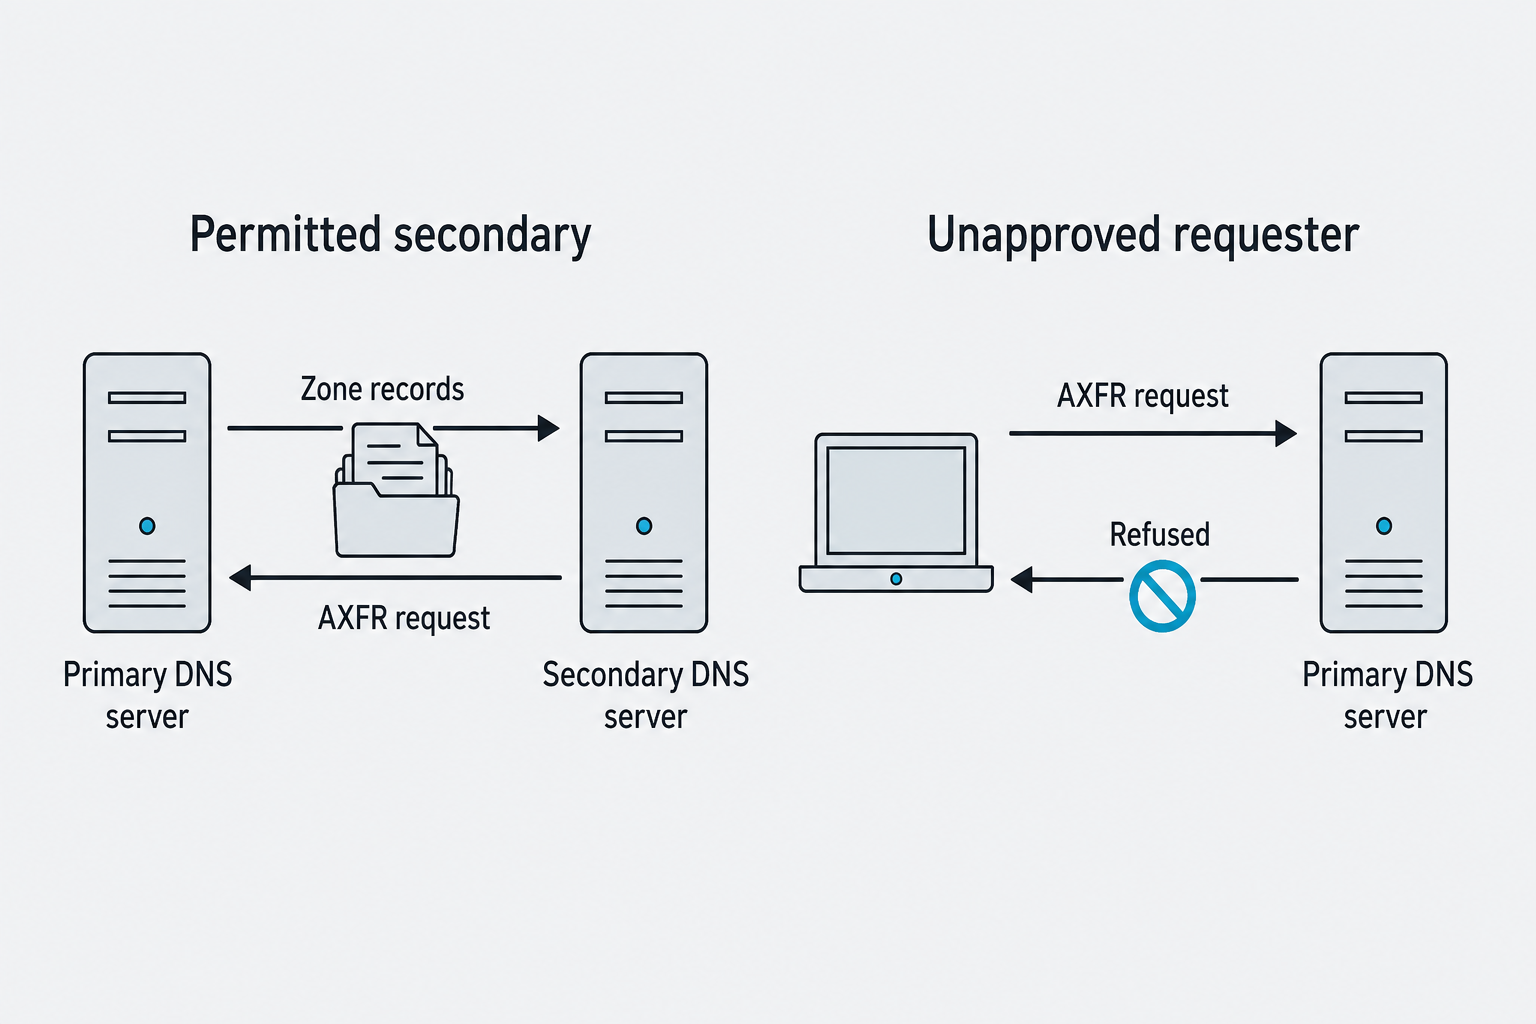
Figure 4.5: A DNS server can supply zone records to a permitted secondary while refusing an unapproved requester.
Text description for Figure 4.5
On the left, a secondary DNS server sends an AXFR request, a request for a full zone transfer, to the primary. The primary returns zone records. On the right, an unapproved requester sends the same request and receives Refused. This depicts access restrictions on zone replication. An authorized tester's engagement permission does not itself make the tester a permitted DNS transfer client.
Certificate Transparency
Certificate Transparency (CT) is a public, append-only log system that records publicly trusted Transport Layer Security certificates as they are issued. Browsers require it, so in practice every certificate an organization obtains from a public authority is published.
That has a consequence the organization rarely thinks through: certificates name hosts, so the logs are a public list of hostnames. Searching a CT log aggregator such as crt.sh for a domain returns every name that has appeared in a certificate for it.
api.example.com
staging.example.com
admin-panel.example.com
internal-vpn.example.com
partner-portal.example.com
old-test.example.com
This routinely exposes staging, test, and administrative hosts that were protected by obscurity. The organization put a certificate on the host because it wanted encryption, and the certificate published the host's existence to the world.
Analyst Perspective
Certificate transparency searches are the highest-yield passive technique available today, and they cost one web request. Names containing dev, test, staging, uat, old, or legacy deserve attention first: they tend to run older software, hold copies of production data, and sit outside the patching process that covers the systems anyone remembers.
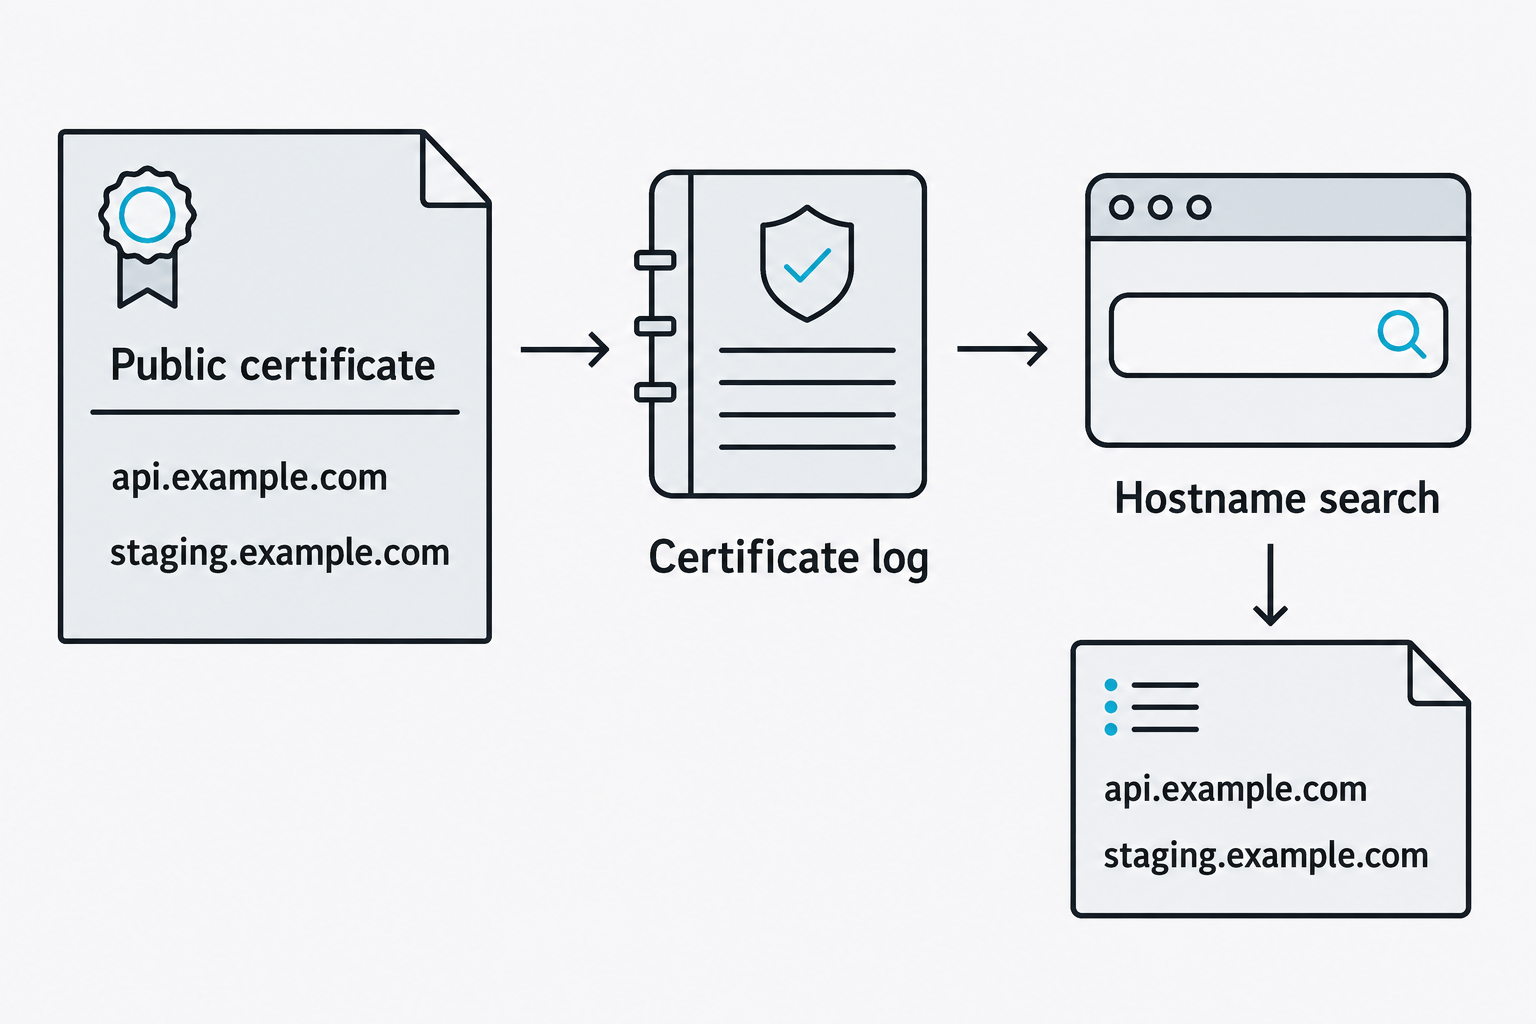
Figure 4.6: Certificate logs can expose hostnames recorded in public certificates.
Text description for Figure 4.6
The example public certificate contains api.example.com and staging.example.com. A certificate log records the certificate, and a hostname search retrieves those names. This is a simplified Certificate Transparency (CT) lookup path. Logged names can include old or unused services and do not prove current DNS resolution, reachability, ownership, or a complete host inventory.
Registration Data and Address Space
Registration lookups turn a domain into address space.
whois example.com
returns the registrar, nameservers, status codes, and dates, with registrant contact fields commonly redacted.
whois 192.0.2.1
returns the allocated block and the organization it belongs to, which turns one host into a range.
whois AS64496
returns the address blocks announced by an autonomous system number (ASN), the identifier assigned to an organization that operates its own routing on the internet. An organization large enough to hold an ASN can have its entire public address footprint enumerated from it.
The chain is worth walking deliberately. Resolve the domain to an address; look up the address to find the block and the owning organization; look up that organization's autonomous system to find every other block it holds. You began with one name and finished with the organization's public address space, without sending a packet to any of it.
Confirm ownership before you scan
Address blocks change hands, and shared hosting means an address returned by a lookup may belong to a provider serving thousands of unrelated customers. An address that appears in a registration record is not automatically in your scope. Match every range against the signed scope document before it goes into a scanner.
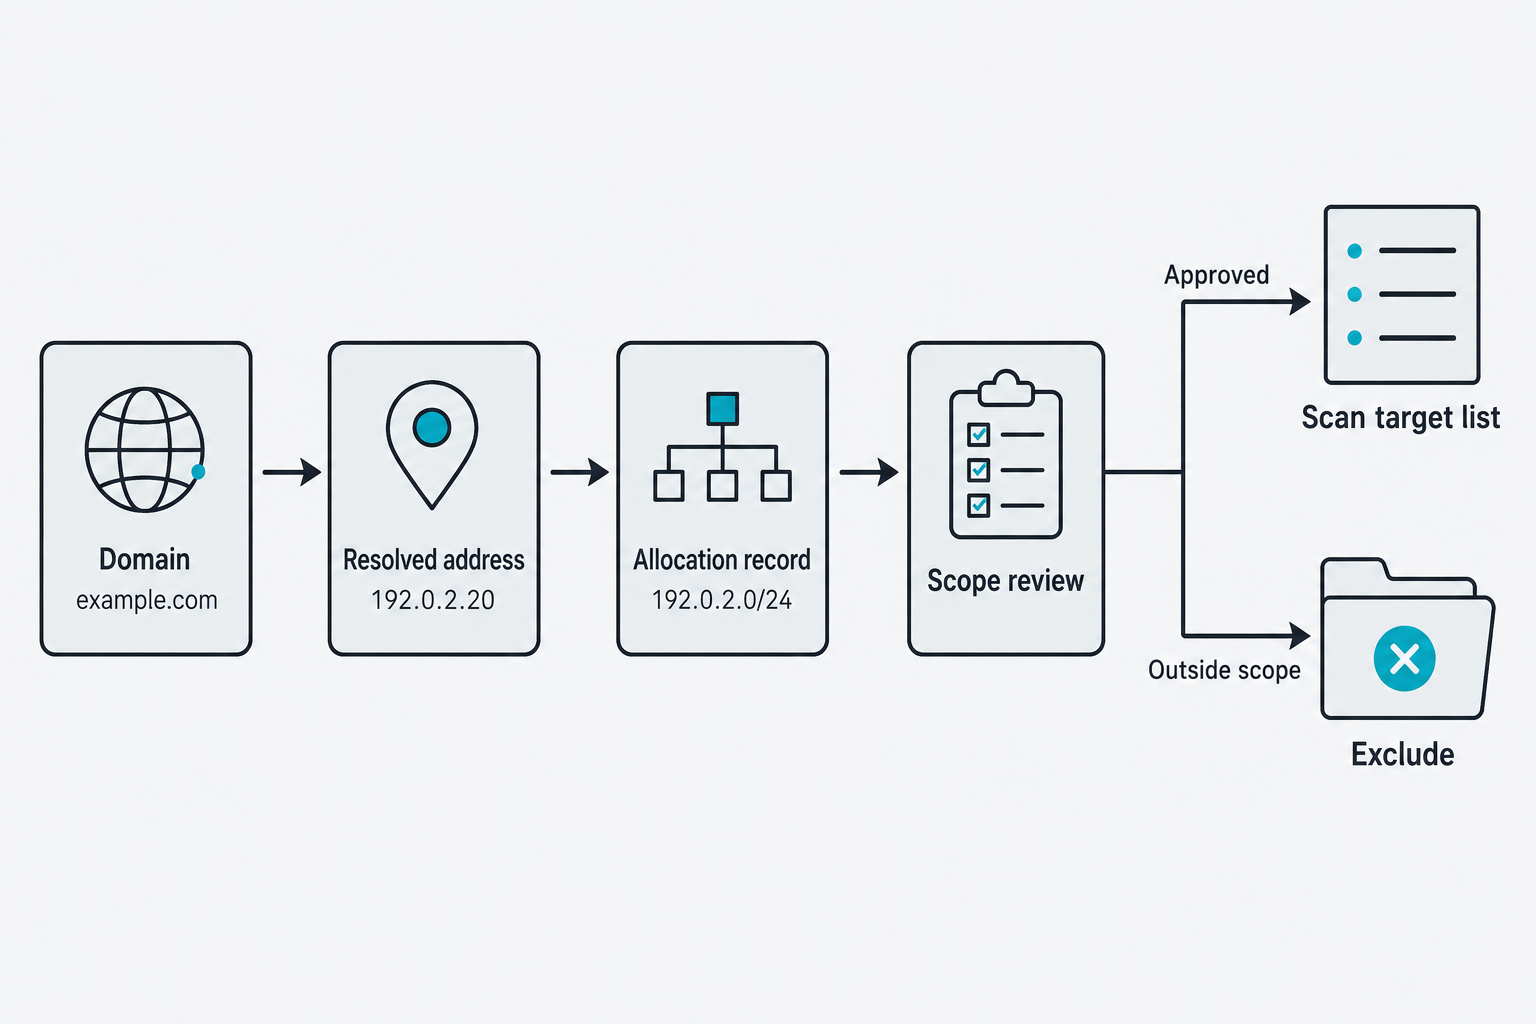
Figure 4.7: Address research identifies candidate ranges that must pass a scope review before scanning.
Text description for Figure 4.7
The fictional sequence begins with example.com, resolves to 192.0.2.20, and finds an allocation record for 192.0.2.0/24. Scope review compares the candidate with the engagement's authorization. Approved targets enter the scan list; targets outside scope are excluded. Allocation and hosting relationships alone do not grant permission.
4.5 Internet-Wide Scan Data and OSINT Frameworks
Some organizations scan the entire internet continuously and publish the results. Querying them gives you scan data about your target without scanning your target.
Shodan and Censys
Shodan indexes banners from internet-connected services. A query returns addresses, ports, service and version strings, certificate data, and location estimates.
Filters combine to narrow a search:
org:"Example Corporation"matches the organization recorded for the address block.hostname:example.commatches hosts whose name contains the string.net:192.0.2.0/24matches an address range directly, which is the most reliable filter once registration lookups have given you ranges.port:3389 org:"Example Corporation"finds exposed remote desktop services.product:"Apache httpd"matches an identified product.http.title:"Dashboard"matches text in a web page title, which finds administrative interfaces efficiently.
Censys performs a similar function with deeper certificate integration, which makes it stronger for mapping an organization's certificate estate and finding hosts through the names on their certificates. It sits outside the nine-tool core toolkit from section 4.2 because it duplicates Shodan's role; learn Shodan first and treat Censys as the second opinion.
The limitation applies to both: they only see what is reachable from the internet on ports they scan. Internal systems are invisible, and a service on an unusual port may be missed for a long time.
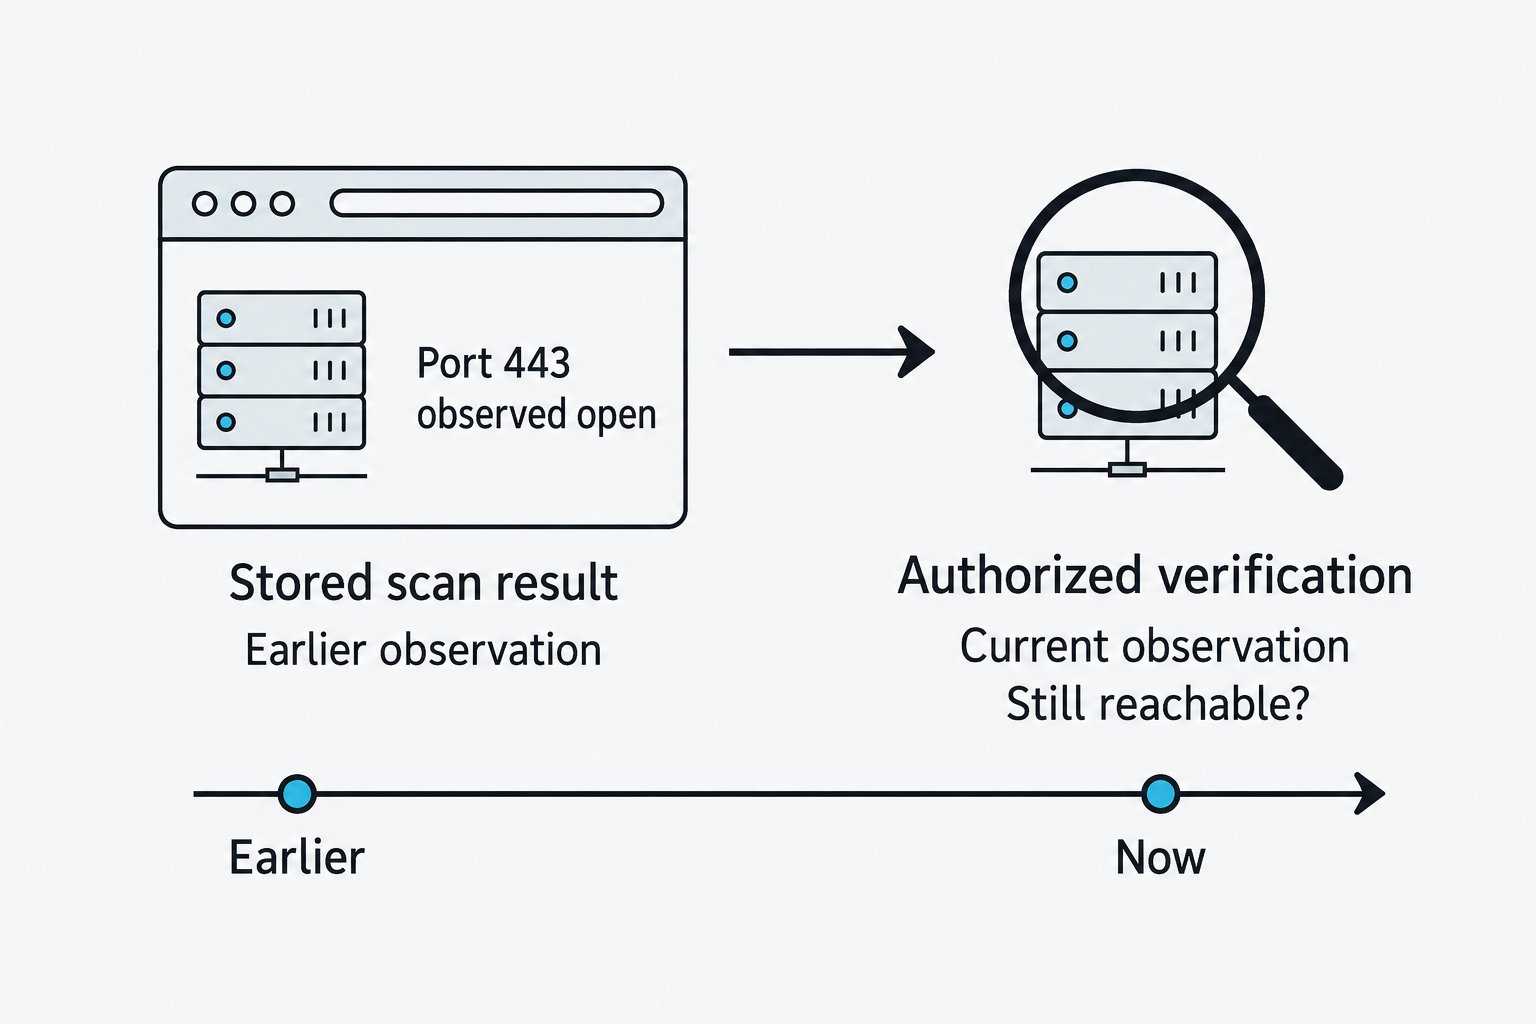
Figure 4.8: Stored internet scan data provides an earlier observation for authorized verification.
Text description for Figure 4.8
The browser represents stored scan data that previously observed port 443 open. A later authorized verification checks current reachability. The timeline moves from Earlier to Now. The figure does not assign a fixed age to search results or assume the earlier observation remains valid. A stored banner is evidence of a past observation and a lead for current testing.
Recon-ng in Practice
Recon-ng automates collection and records it. The sequence below is the current version 5 syntax, run against a workspace created for one engagement.
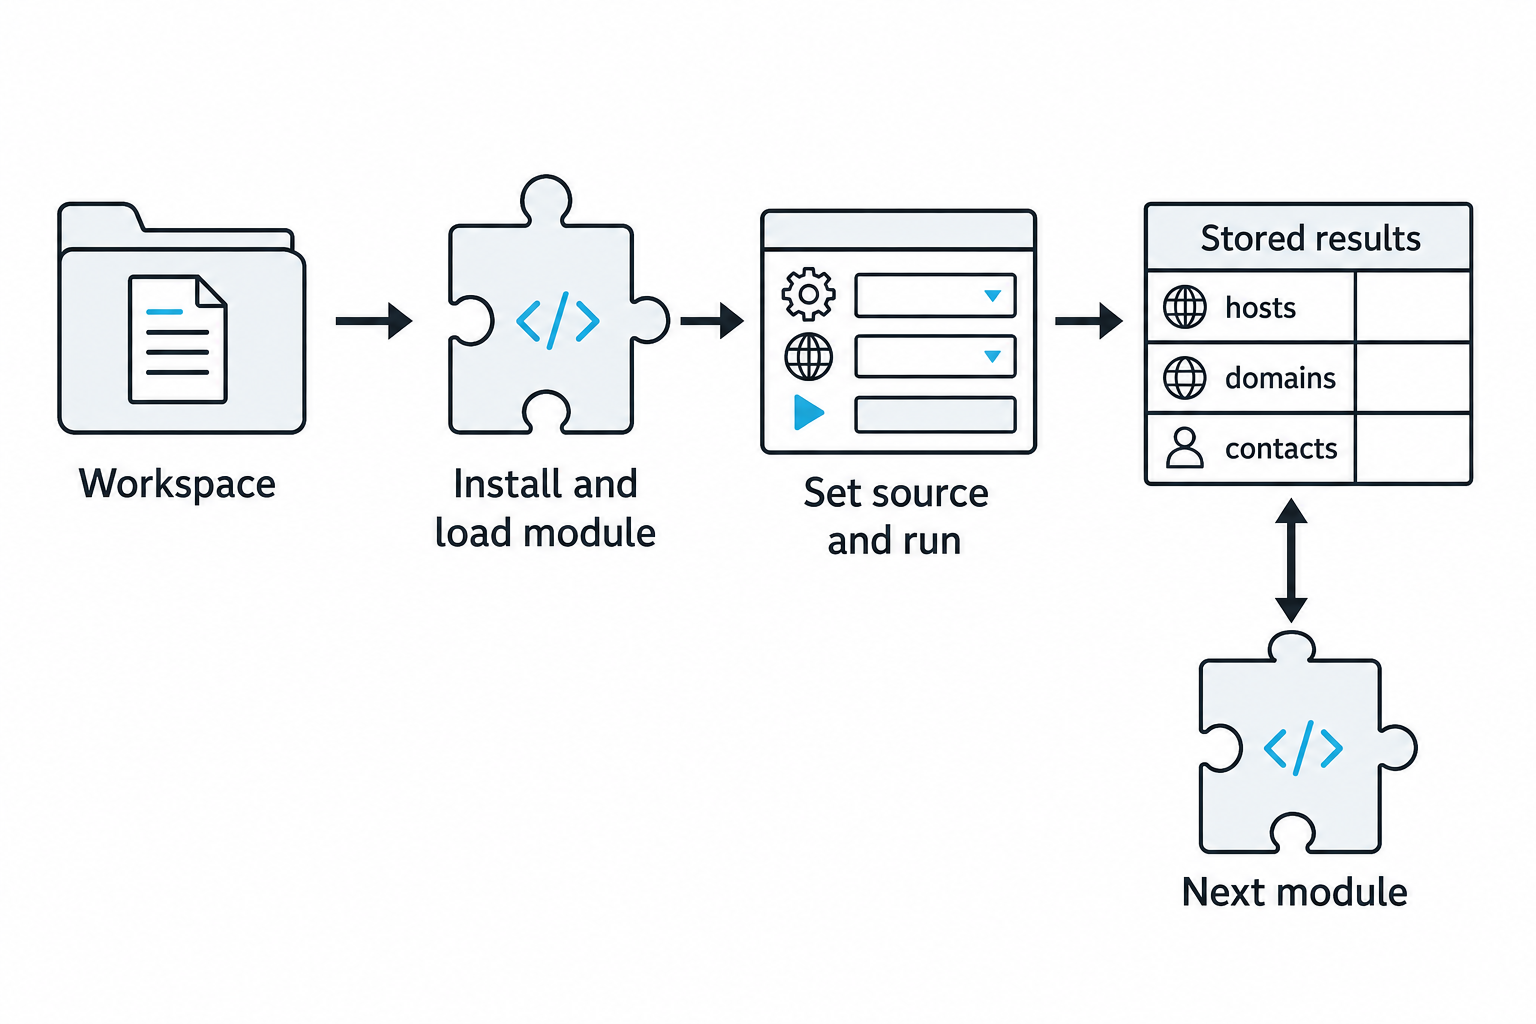
Figure 4.9: Recon-ng modules collect information into a workspace and reuse stored results.
Text description for Figure 4.9
The sequence establishes a workspace, installs and loads a module, sets its source, and runs it. Results populate shared tables illustrated by hosts, domains, and contacts. A two-way arrow links the stored results and the next module, representing reuse and additional collection. Which tables a module reads or writes depends on that module; the diagram summarizes the framework rather than a particular command transcript.
Start the framework and create a workspace so results stay separated from other engagements:
$ recon-ng
[recon-ng][default] > workspaces create example_corp
[recon-ng][example_corp] >
Refresh the module marketplace and find modules for a task:
[recon-ng][example_corp] > marketplace refresh
[*] Marketplace index refreshed.
[recon-ng][example_corp] > marketplace search hosts
Install a module and load it. Note that installation and loading are separate steps, and that the prompt changes to show the loaded module:
[recon-ng][example_corp] > marketplace install recon/domains-hosts/hackertarget
[*] Module installed: recon/domains-hosts/hackertarget
[*] Reloading modules...
[recon-ng][example_corp] > modules load recon/domains-hosts/hackertarget
[recon-ng][example_corp][hackertarget] >
Set the module's input and run it:
[recon-ng][example_corp][hackertarget] > options set SOURCE example.com
SOURCE => example.com
[recon-ng][example_corp][hackertarget] > run
Results are written to the workspace database. Return to the framework level and read them:
[recon-ng][example_corp][hackertarget] > back
[recon-ng][example_corp] > show hosts
The workspace database holds tables including domains, hosts, ports, netblocks, contacts, credentials, leaks, locations, and vulnerabilities. Modules feed each other: a module that discovers hostnames populates hosts, and a resolution module then reads hosts and fills in addresses. That chaining is the reason to use a framework rather than running the same queries by hand.
Modules that require an API key need it registered first, with keys add shodan_api YOUR_KEY. Roughly half of the available modules need no key.
Version 5 changed the commands
use is gone; the command is modules load. Modules are not installed by default; you install them from the marketplace. A fresh Recon-ng reports No modules enabled/installed on startup, which surprises students who expect a full toolbox. Published tutorials, including some official tool pages, still document version 4 syntax.
Framework Comparison
| Tool | Strength | Output | Key required |
|---|---|---|---|
| Search operators | Free, immediate, no account | Web pages and documents | No |
| Certificate transparency | Exhaustive subdomain coverage | Hostnames | No |
| Shodan | Service and version data at internet scale | Addresses, banners, certificates | Free tier; some filters paid |
| Censys | Certificate-centric infrastructure mapping | Addresses, certificates, services | Free tier available |
| Recon-ng | Automation and a recorded evidence trail | Structured database tables | Per module; about half need none |
4.6 Traffic Analysis and Banner Grabbing
Two techniques sit between passive and active. Traffic analysis touches nothing but requires network access. Banner grabbing sends a single connection, which is the smallest possible active footprint.
Packet Capture with tcpdump
With access to a network segment, whether as a gray box tester given a foothold or during an insider threat simulation, captured traffic describes the environment directly.
Start by listing what you can capture on:
$ sudo tcpdump -D
1.eth0 [Up, Running, Connected]
2.any (Pseudo-device that captures on all interfaces) [Up, Running]
3.lo [Up, Running, Loopback]
Capture a bounded sample rather than an open-ended one:
$ sudo tcpdump -i eth0 -n -c 500 -w segment.pcap
The flags matter here. -n disables name resolution, which stops your capture from generating DNS queries that appear in the target's logs. -c 500 bounds the capture. -w writes a file you can analyze offline, which keeps your working time on the segment short.
Filter for the protocols that carry credentials in the clear:
$ sudo tcpdump -i eth0 -n -c 500 -A 'tcp port 21 or tcp port 23 or tcp port 110'
FTP (21), Telnet (23), and the older mail retrieval protocol (110) all transmit authentication in plain text by default. -A prints the payload as text, so credentials appear directly in the output.
What a capture typically yields:
- Cleartext credentials on legacy protocols.
- Internal hostnames and the organization's naming conventions, from DNS queries.
- Which internal systems talk to which, and which external services they depend on.
- Broadcast and discovery protocols that name hosts without being asked.
Capture scope and retention
A capture on a shared segment collects other people's traffic. Authorization to test a system is not authorization to record its users' sessions. Get packet capture named explicitly in the rules of engagement, capture the minimum needed, and agree in writing what happens to the capture files when the engagement ends.
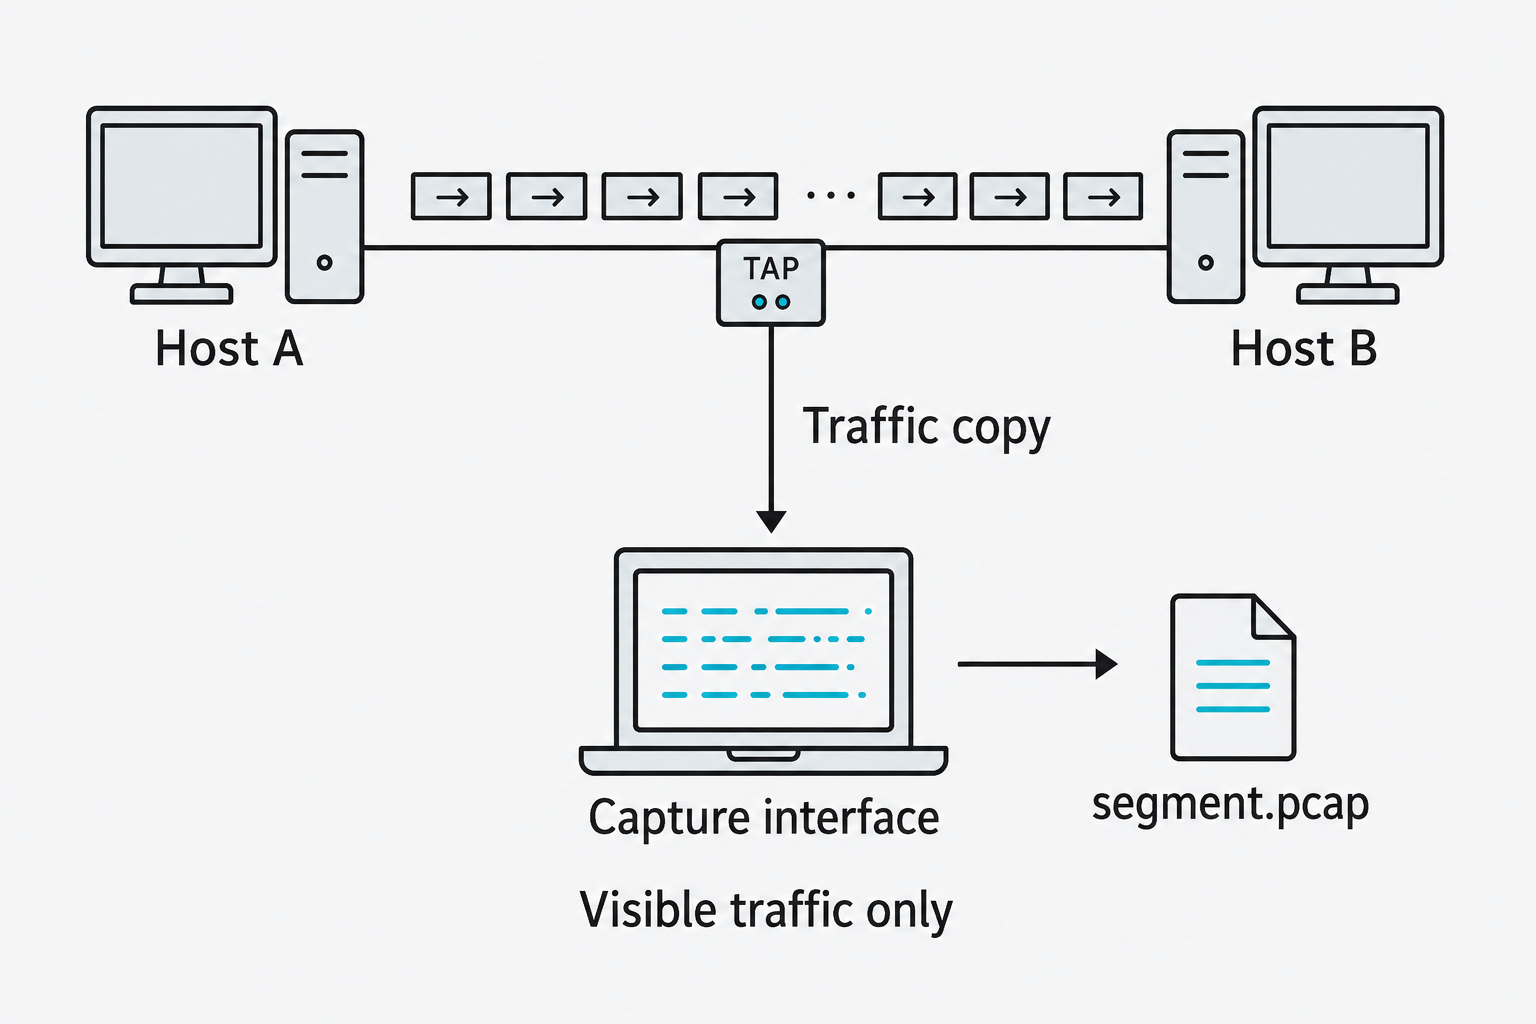
Figure 4.10: Packet capture records the traffic visible at its collection point.
Text description for Figure 4.10
Packets move between Host A and Host B. A network tap provides a copy to the capture interface, which writes segment.pcap, a packet-capture file. The capture laptop sends no probes in this diagram. A tap is one possible collection arrangement. Visibility depends on the interface, network configuration, and permitted collection point; simply joining a switched network does not expose all traffic.
Banner Grabbing
Banner grabbing means connecting to a service and reading what it announces. Many services identify their software and version on connection without being asked.
Services that speak first, such as Secure Shell (SSH), need only a connection:
$ nc -v -w 5 192.0.2.10 22
Connection to 192.0.2.10 22 port [tcp/ssh] succeeded!
SSH-2.0-OpenSSH_7.4
That single line is worth a great deal. It names the implementation and the version, which is enough to search a vulnerability database for known issues affecting it.
Services that wait for a request, such as web servers, need one sent:
$ printf 'HEAD / HTTP/1.1\r\nHost: example.com\r\nConnection: close\r\n\r\n' | nc -v example.com 80
Connection to example.com (192.0.2.20) 80 port [tcp/http] succeeded!
HTTP/1.1 200 OK
Date: Wed, 12 Aug 2026 14:22:31 GMT
Server: Apache/2.4.41 (Ubuntu)
Content-Type: text/html; charset=UTF-8
The Server header names the web server, its version, and the distribution it was packaged for.
Use printf, not echo
Hypertext Transfer Protocol (HTTP) requires carriage return and line feed to end each header line. echo sends a bare line feed on most systems, and many servers will simply wait for the rest of a request that never arrives. printf with explicit \r\n sends what the protocol requires.
Nmap automates the same work at scale with -sV, which sends protocol-appropriate probes and matches responses against a fingerprint database. Manual banner grabbing remains valuable for two reasons: it confirms what a scanner reported, and it works when a scanner is not available or not permitted.
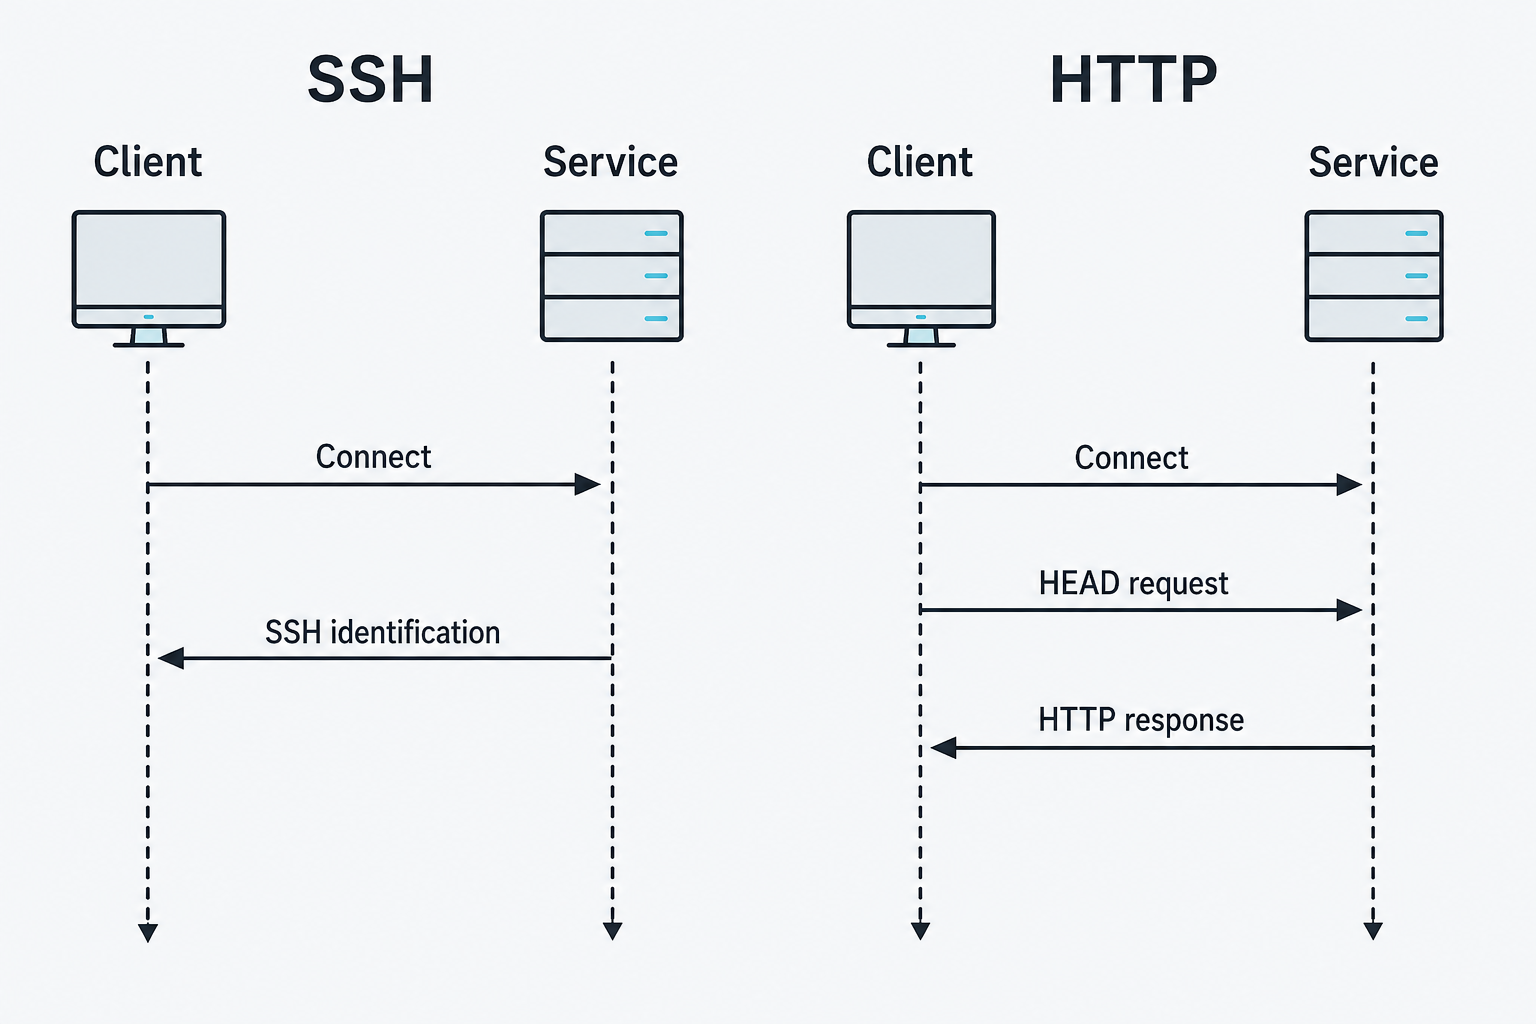
Figure 4.11: Banner collection depends on when the service sends identifying information.
Text description for Figure 4.11
Time runs downward along each lifeline. For SSH (Secure Shell), the client connects and reads the service's identification string. For HTTP (Hypertext Transfer Protocol), the client connects, sends HEAD to request response headers, and reads the response. These are simplified banner-reading exchanges. SSH peers also send their own identification during a full protocol exchange. Banners may omit, alter, or misstate software versions.
4.7 Active Host Discovery and Scanning
At some point passive collection is exhausted and you send traffic at the target. Everything from here appears in the target's logs, and everything from here requires written authorization naming the systems involved.
Ping Sweeps
The simplest active question is which addresses respond. A loop does it with nothing but ping:
$ for i in $(seq 1 254); do ping -c 1 -W 1 192.0.2.$i | grep "bytes from"; done
64 bytes from 192.0.2.1: icmp_seq=1 ttl=255 time=1.42 ms
64 bytes from 192.0.2.10: icmp_seq=1 ttl=64 time=0.88 ms
64 bytes from 192.0.2.50: icmp_seq=1 ttl=128 time=1.10 ms
Read more than the addresses. The initial time-to-live value hints at the operating system: values near 64 suggest Linux or Unix, near 128 suggest Windows, near 255 suggest a network device. It is a hint, not a determination, since intermediate routers decrement the value and administrators can change the default.
Nmap does the same job better:
$ sudo nmap -sn 192.0.2.0/24
Starting Nmap 7.99 ( https://nmap.org ) at 2026-08-12 14:18 UTC
Nmap scan report for gateway.example.com (192.0.2.1)
Host is up (0.0014s latency).
Nmap scan report for 192.0.2.10
Host is up (0.00088s latency).
Nmap scan report for 192.0.2.50
Host is up (0.0011s latency).
Nmap done: 256 IP addresses (3 hosts up) scanned in 2.94 seconds
-sn performs host discovery with no port scan. Run with privileges, it does not rely on ICMP alone: it sends an ICMP echo request, a TCP SYN to port 443, a TCP ACK to port 80, and an ICMP timestamp request, so a host that drops ping but answers on a web port is still found. On a local Ethernet segment it uses Address Resolution Protocol (ARP) requests instead, which cannot be firewalled off and is close to definitive.
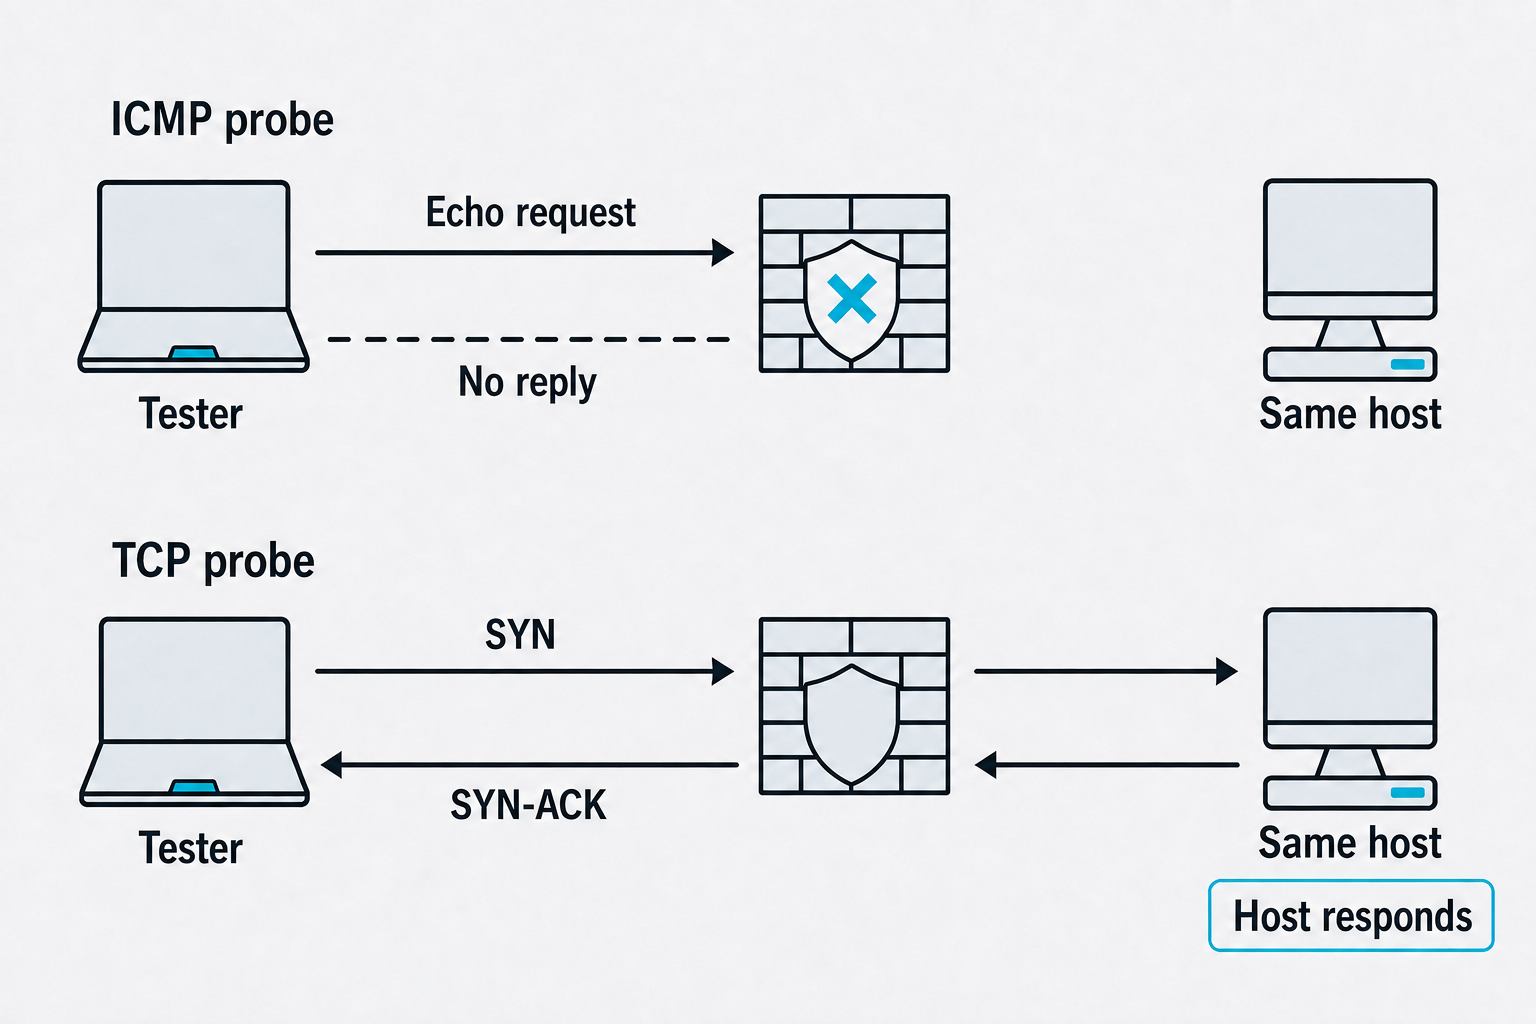
Figure 4.12: A host that does not answer an ICMP probe may still respond to a permitted TCP probe.
Text description for Figure 4.12
The top row shows an ICMP (Internet Control Message Protocol) echo request stopping at a firewall, with no reply reaching the tester. The lower row shows a TCP (Transmission Control Protocol) SYN connection request reaching the same host and a SYN-ACK acknowledgment returning through the firewall. This is one illustrative filtering policy, not a guarantee that TCP succeeds whenever ping fails.
Port Scanning
Two TCP scan types cover most work.
A TCP connect scan (-sT) asks the operating system to open a full connection to each port. If the handshake completes, the port is open. It needs no special privileges, and because it completes connections, applications log it as a genuine connection attempt.
A TCP SYN scan (-sS) sends a SYN packet and interprets the reply: SYN-ACK means open, RST means closed, no response means filtered. It never completes the handshake, so many applications never record the connection. It requires privileges because it constructs raw packets. It is faster than a connect scan and is Nmap's default when run with privileges.
UDP scanning (-sU) is a different problem. UDP is connectionless, so there is no handshake to interpret. Nmap infers state from ICMP port unreachable messages, which operating systems rate-limit, making UDP scans slow enough that scanning all 65,535 UDP ports is rarely practical. Scan the ports that matter: 53 (DNS), 67 and 68 (address assignment), 123 (time), 161 (network management), 500 (key exchange).
Nmap does not scan every port by default
With no -p flag, Nmap scans the 1,000 most commonly used ports per protocol, chosen by observed frequency, not ports 1 through 1000. A service deliberately placed on an unusual port is invisible to a default scan. Use -p- for all 65,535 ports when the engagement allows the time, and say in the report which you ran.
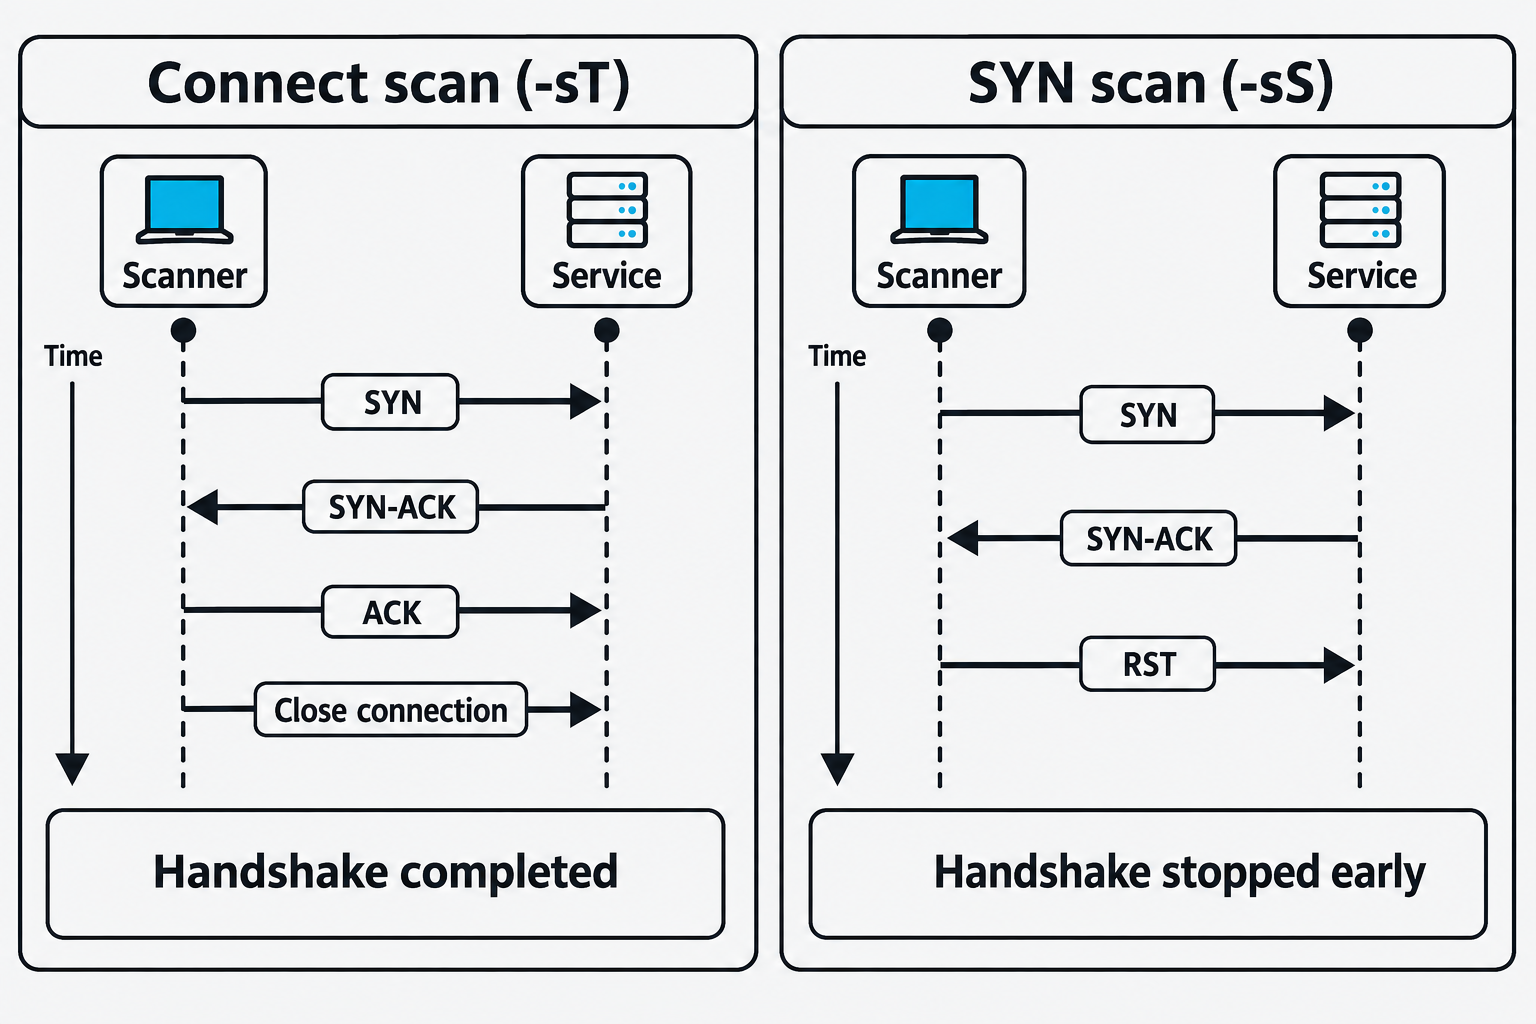
Figure 4.13: Connect and SYN scans handle an open TCP port differently.
Text description for Figure 4.13
Time runs downward. In the connect scan, SYN requests a connection, SYN-ACK acknowledges the request, and ACK completes the handshake. The scanner then closes the connection; Close connection summarizes teardown rather than a single mandated packet. In the SYN scan, the scanner receives SYN-ACK and sends RST, a reset, without completing the handshake. Both scan types can be detected and require appropriate authorization.
Service and Version Detection
Knowing a port is open is thin intelligence. Knowing what is behind it is actionable.
$ sudo nmap -sV -p 22,80,443,3389 192.0.2.50
Starting Nmap 7.99 ( https://nmap.org ) at 2026-08-12 14:22 UTC
Nmap scan report for 192.0.2.50
Host is up (0.0011s latency).

PORT     STATE SERVICE       VERSION
22/tcp   open  ssh           OpenSSH 7.4 (protocol 2.0)
80/tcp   open  http          Apache httpd 2.4.6 ((CentOS))
443/tcp  open  ssl/http      Apache httpd 2.4.6 ((CentOS))
3389/tcp open  ms-wbt-server Microsoft Terminal Services

Service detection performed. Please report any incorrect results at https://nmap.org/submit/ .
Nmap done: 1 IP address (1 host up) scanned in 12.41 seconds
That output is a work queue. OpenSSH 7.4 and Apache 2.4.6 are both old enough to have a documented vulnerability history, the CentOS packaging hints at the distribution and its support status, and exposed remote desktop is worth attention on its own.
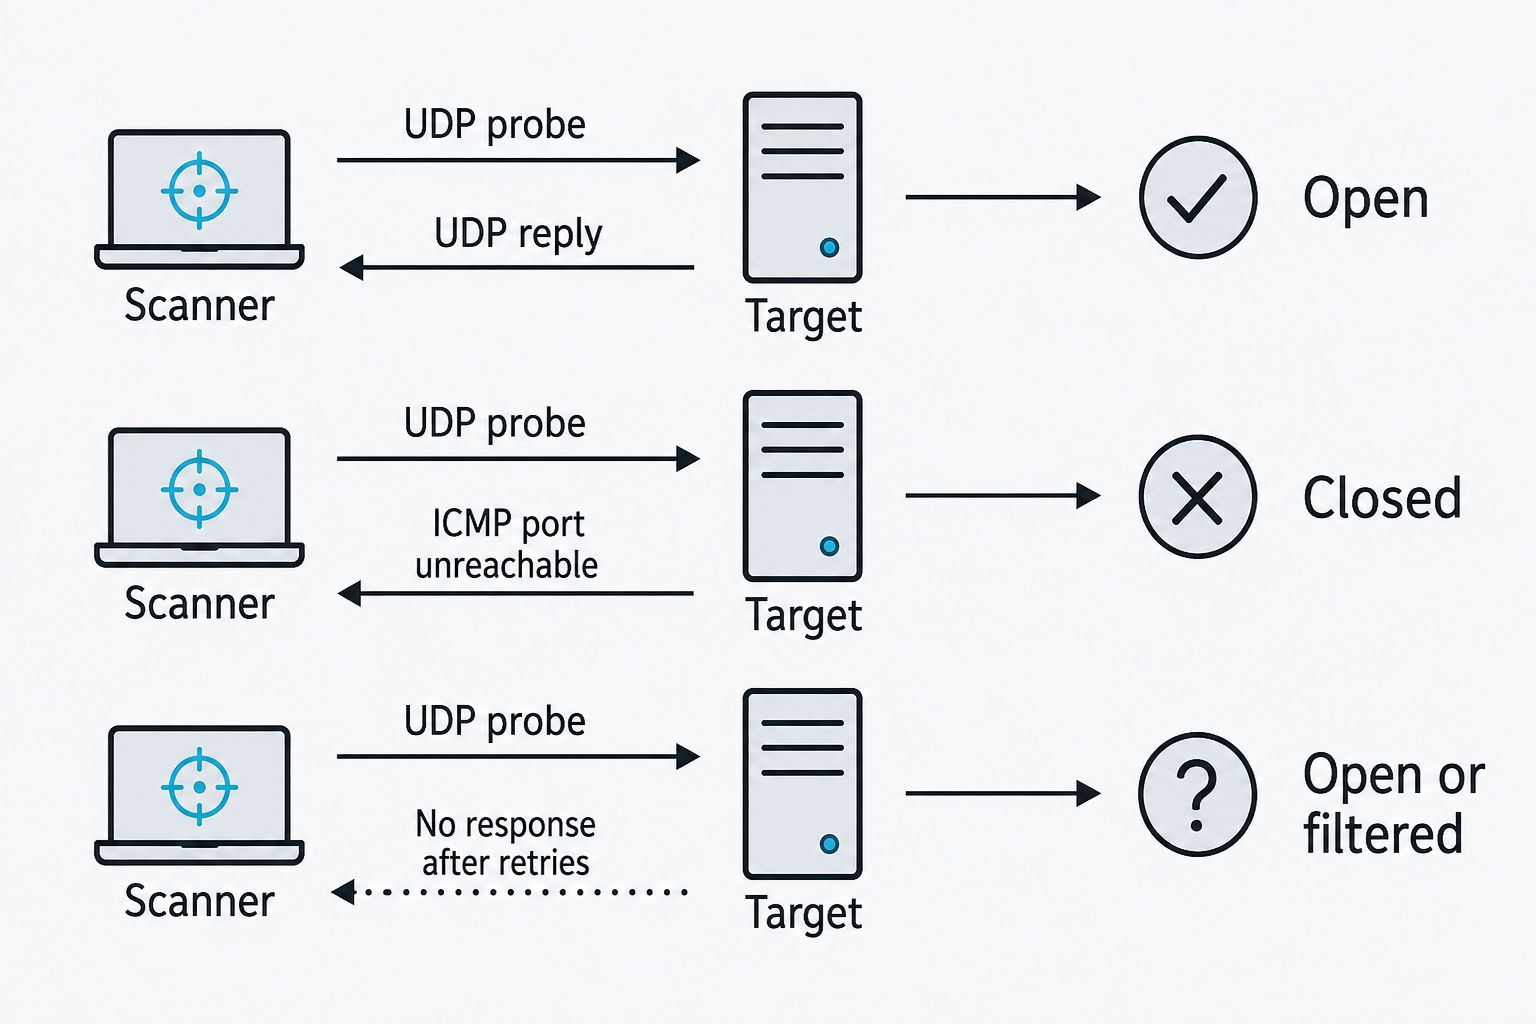
Figure 4.14: UDP scan results depend on the response, and silence can leave the port state unresolved.
Text description for Figure 4.14
Each row starts with a UDP (User Datagram Protocol) probe. A UDP reply establishes an open port. An IPv4 ICMP port-unreachable message, type 3 code 3, indicates closed. No response after retries produces open|filtered in Nmap because silence alone cannot separate an open service from filtering. Other ICMP errors can indicate filtering. The dotted no-response line represents absence of a reply.
Operating System Detection
$ sudo nmap -O 192.0.2.50
Starting Nmap 7.99 ( https://nmap.org ) at 2026-08-12 14:31 UTC
Nmap scan report for 192.0.2.50
Host is up (0.0011s latency).
Not shown: 996 closed tcp ports (reset)
PORT     STATE SERVICE
22/tcp   open  ssh
80/tcp   open  http
443/tcp  open  https
3389/tcp open  ms-wbt-server

Device type: general purpose
Running: Linux 3.X|4.X
OS CPE: cpe:/o:linux:linux_kernel:3 cpe:/o:linux:linux_kernel:4
OS details: Linux 3.10 - 4.11
Network Distance: 2 hops

OS detection performed. Please report any incorrect results at https://nmap.org/submit/ .
Nmap done: 1 IP address (1 host up) scanned in 8.72 seconds
Nmap compares subtle characteristics of the target's responses, including TCP window sizes, option ordering, and initial sequence number generation, against a database of thousands of fingerprints. Accuracy drops when firewalls, load balancers, or network address translation sit in the path, and the output is best read as a strong hint.
The -A flag combines operating system detection, version detection, default scripts, and traceroute in one run. It is convenient and it is loud, so save it for engagements where detection is not a concern.
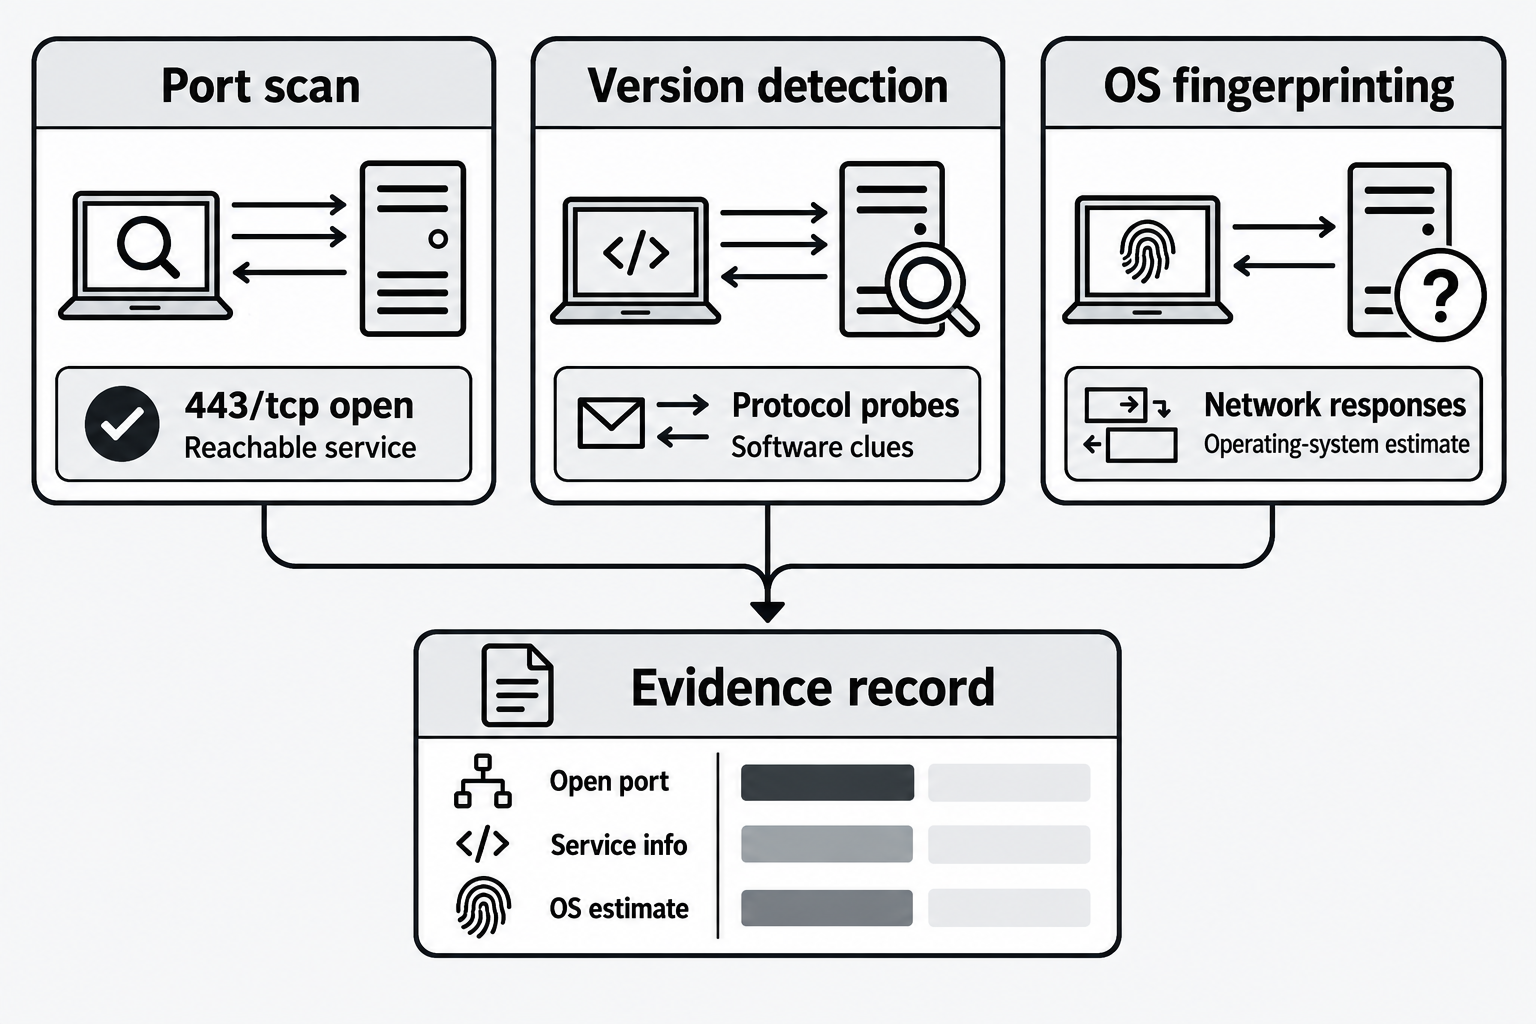
Figure 4.15: Port, service, and operating-system observations contribute different evidence.
Text description for Figure 4.15
The port scan reports the illustrative observation 443/tcp open, indicating an accepting service. Version detection sends protocol probes to obtain software clues. OS (operating system) fingerprinting compares network response characteristics to estimate the operating system. All three feed an evidence record. The bars are symbolic fields without numeric meaning. A familiar port number or version string does not independently establish the software's identity or a vulnerability.
The Nmap Scripting Engine
The Nmap Scripting Engine (NSE) runs Lua scripts against scan results, extending Nmap from a port scanner into a light enumeration and vulnerability assessment tool. Scripts are organized into categories including default, safe, discovery, vuln, auth, and intrusive.
$ sudo nmap --script "http-title,http-headers" -p 80,443 192.0.2.50
Category names work in place of script names, so --script vuln runs the vulnerability category. Read the category before running it: intrusive scripts can crash services, and exploit scripts attempt actual exploitation, which is very likely outside the scope of a reconnaissance phase.
Recording What You Did
Every scan should write output to a file:
$ sudo nmap -sV -oA scans/192.0.2.50-services 192.0.2.50
-oA writes three formats at once: human-readable, XML for tooling, and grepable for the command line. Two reasons this is not optional. Your report's findings need evidence with a timestamp attached, and if a client asks whether you were responsible for traffic they saw at a particular moment, your scan logs are the answer.
4.8 Building a Reconnaissance Workflow
The tools have an order. The first seven rows below run from least detectable to most. Traffic analysis sits outside that ordering because what it requires is network access rather than exposure.
| Phase | Tools | Output | Detectable by target |
|---|---|---|---|
| Public research | Search operators, employment sites, repositories, archives | Names, technologies, documents | No |
| Third-party queries | whois, RDAP, certificate transparency, Shodan, Censys | Domains, address ranges, exposed services | No |
| Automated OSINT | Recon-ng | Structured database of the above | No |
| DNS interrogation | dig, nslookup | Records, hostnames, zone data | Minimal, in DNS query logs |
| Host discovery | ping, nmap -sn |
Live hosts | Low |
| Port scanning | nmap -sS, -sT, -sU |
Open ports | Medium to high |
| Service identification | nmap -sV, Netcat |
Software and versions | Medium to high |
| Traffic analysis | tcpdump | Protocols, credentials, relationships | None, but requires network access |
Two rules govern the sequence. Exhaust each phase before starting the next, because information from a passive phase narrows the active work and reduces both the time it takes and the noise it makes. And do not begin any active phase until the written authorization covering it is signed and in your hands.
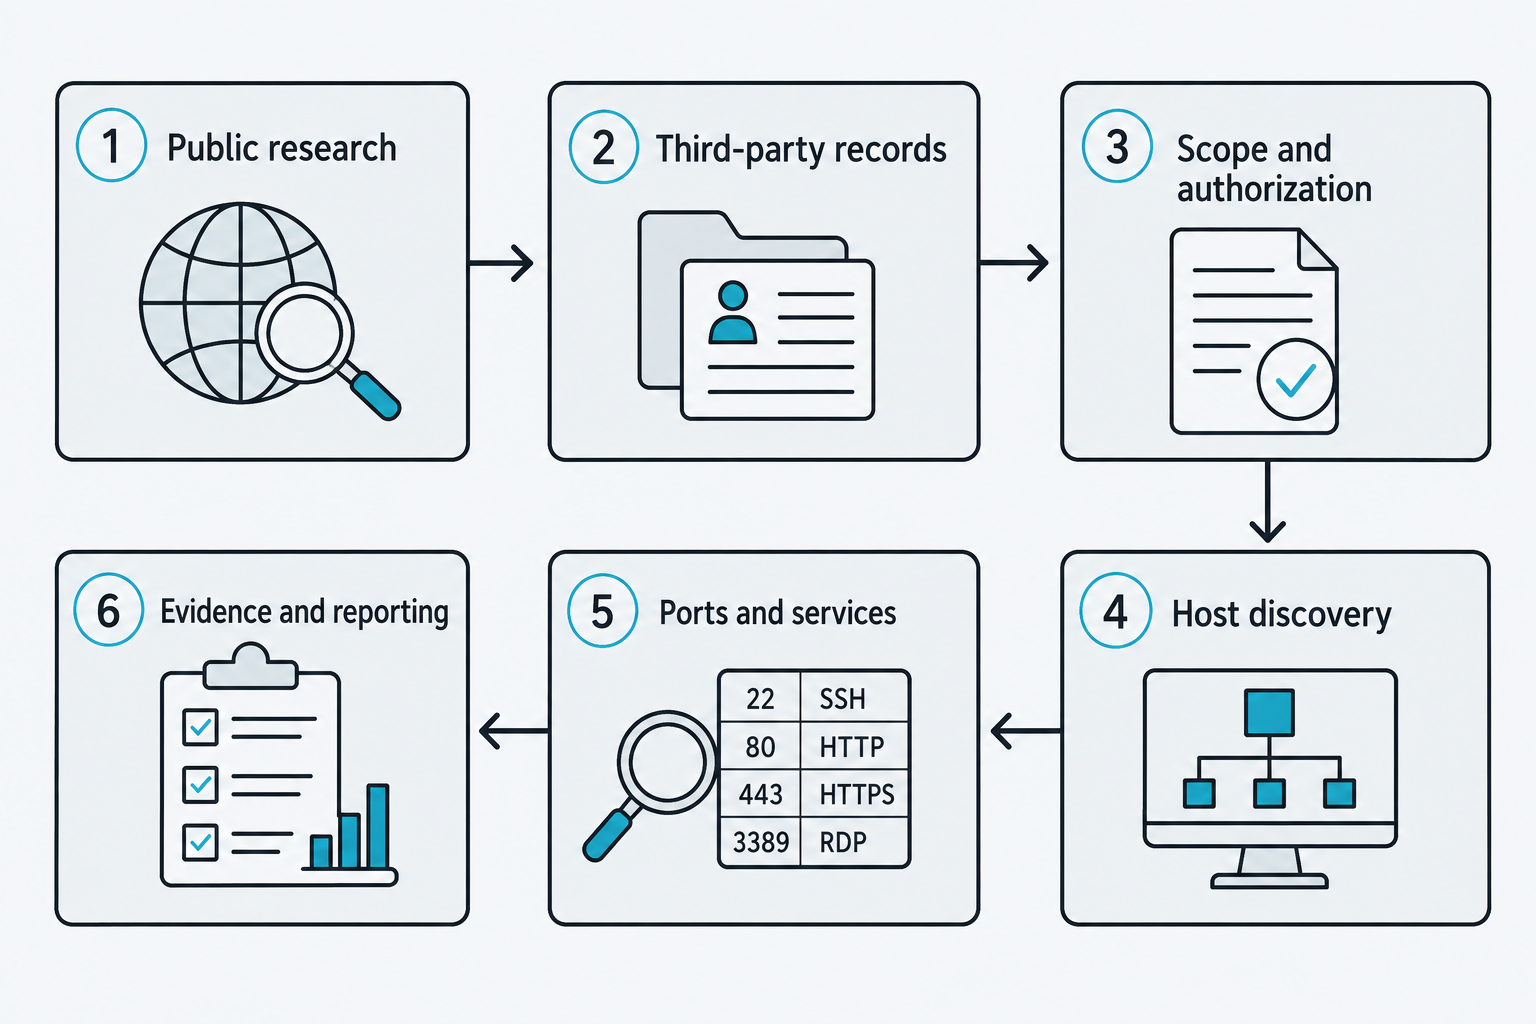
Figure 4.16: Reconnaissance moves from public information through authorized discovery to documented evidence.
Text description for Figure 4.16
Read steps 1 through 3 left to right across the top, then steps 4 through 6 right to left across the bottom. Public research and third-party records narrow the candidates. Scope and authorization precede host discovery and service interaction. Findings feed evidence and reporting. The familiar port labels are examples of common associations, not guaranteed service identities. This overview compresses the chapter's workflow; capture requires its own authorized access and evidence should be retained throughout.
Putting It Together: A Reconnaissance Case Study
You have a black box engagement against Example Corporation. You are given one thing: the domain example-corp.com.
Days 1 to 4: public research. Search operators against the domain return the main site, a support portal, and an old marketing subdomain. A published implementation guide, found with a file type search, names the internal address scheme as 10.20.0.0/16 in an appendix diagram. Employment listings name Kubernetes, PostgreSQL, and a specific monitoring platform. A developer's public repository contains a configuration file with a comment referencing db-prod-01.internal.
Day 5: registration and certificate data. A registration lookup on the domain returns a redacted registrant, the registrar, and the nameservers. Resolving www.example-corp.com gives 192.0.2.15. A lookup on that address returns the block 192.0.2.0/24 allocated to Example Corporation, and an autonomous system number. Querying that number returns three blocks: 192.0.2.0/24, 198.51.100.0/24, and 203.0.113.0/24. A certificate transparency search returns eleven hostnames, including vpn.example-corp.com, grafana.example-corp.com, and legacy-portal.example-corp.com.
Day 6: internet scan data. Shodan queried by address range rather than organization name, net:192.0.2.0/24, returns a monitoring dashboard at 192.0.2.50 on port 3000, with a version string in the banner that matches a published vulnerability. Nothing you have done so far has sent a single packet to Example Corporation.
Day 7: DNS interrogation, now authorized. Zone transfer attempts against both nameservers are refused, which is the correct configuration and worth noting as a positive observation. Forward resolution of the eleven certificate transparency hostnames places nine of them inside the three known ranges. Reverse lookups across 192.0.2.0/24 return descriptive names for fourteen addresses, including bak-fileserver and dev-api-02.
Days 8 to 10: active discovery. A host discovery sweep across all three ranges finds 37 live hosts. A SYN scan of the monitoring host confirms ports 22, 80, 443, 3000, and 9090. Version detection identifies the monitoring platform and its version, matching the Shodan banner. A manual banner grab against port 22 confirms the SSH version independently.
Where that leaves you. You have the organization's public address space, a labeled map of most of it, a technology stack, an internal address scheme, and one internet-facing service running software with a known vulnerability. Six of the ten days produced no traffic to the target at all, and the four days that did were authorized, scheduled, and logged on your side as well as theirs.
Chapter Summary
- The reconnaissance toolkit is ping and Nmap for discovery and scanning, nslookup and dig for DNS, whois for registration data, Shodan for internet-wide scan data, Recon-ng for automating collection, tcpdump for traffic analysis, and Netcat for talking to a service by hand.
- Passive reconnaissance collects from public sources and leaves no trace with the target. Active reconnaissance sends traffic and appears in logs. Most engagements move through a continuum between them rather than choosing one.
- Operational security is the deliberate management of the traces your own activity leaves. Its weight depends on the engagement: central to a black box or red team exercise, secondary to an announced assessment.
- OSINT draws on search operators, employment data, code repositories, archived pages, and breach data. It is slow, uneven, and repeatedly decisive.
- DNS reconnaissance covers forward and reverse lookups, zone transfer attempts, and certificate transparency logs. Certificate transparency is the highest-yield passive technique available today.
- Registration data turns a domain into address space through domain, address, and autonomous system lookups. Note that RDAP has replaced WHOIS as the authoritative source for generic top-level domains, and that registrant contacts are now commonly redacted.
- Shodan and Censys supply scan data about a target without you scanning it, bounded by what is internet-reachable and by how recently their crawlers passed.
- tcpdump reveals protocols, relationships, and cleartext credentials on a segment you can reach, and needs explicit authorization because it captures other people's traffic.
- Banner grabbing with Netcat identifies software and versions one service at a time. Nmap's
-sVdoes the same work at scale. - Active discovery moves from ping sweeps to port scans to service and operating system detection. Nmap scans the 1,000 most common ports unless told otherwise, and every scan should write output to a file.
Chapter 5 picks up where scanning ends. Once you know which hosts are alive and which services they run, enumeration extracts the detail those services will surrender: user accounts, shares, configurations, and the specifics that turn a service version into an attack path.