CH12: Attack Methodology Frameworks and the Incident Response Process
Introduction
Every cyberattack unfolds in phases. An attacker does not materialize inside your network and immediately steal data. Instead, attackers follow a methodology: they develop objectives, conduct reconnaissance, establish entry points, move laterally, establish persistence, harvest credentials, and extract data. The timeline from first compromise to detection might be weeks or months.
Understanding attack methodology is fundamental to incident response. When you detect suspicious activity, you must answer critical questions: How did the attacker enter? How long have they been here? What systems have they accessed? Are they still active? What data is at risk? Attack frameworks provide models that help analysts answer these questions by mapping observed indicators to phases of the attack lifecycle.
This chapter introduces three complementary frameworks: the Cyber Kill Chain (linear phases), the Diamond Model (relationships between adversary, capability, infrastructure, and victim), and MITRE ATT&CK (comprehensive taxonomy of techniques used in real world). It then covers the incident response process: preparation, detection, analysis, containment, eradication, recovery, and post-incident activities.
By the end of this chapter, you will be able to map incidents to attack frameworks, understand the incident response lifecycle, and use frameworks to guide investigation and response decisions.
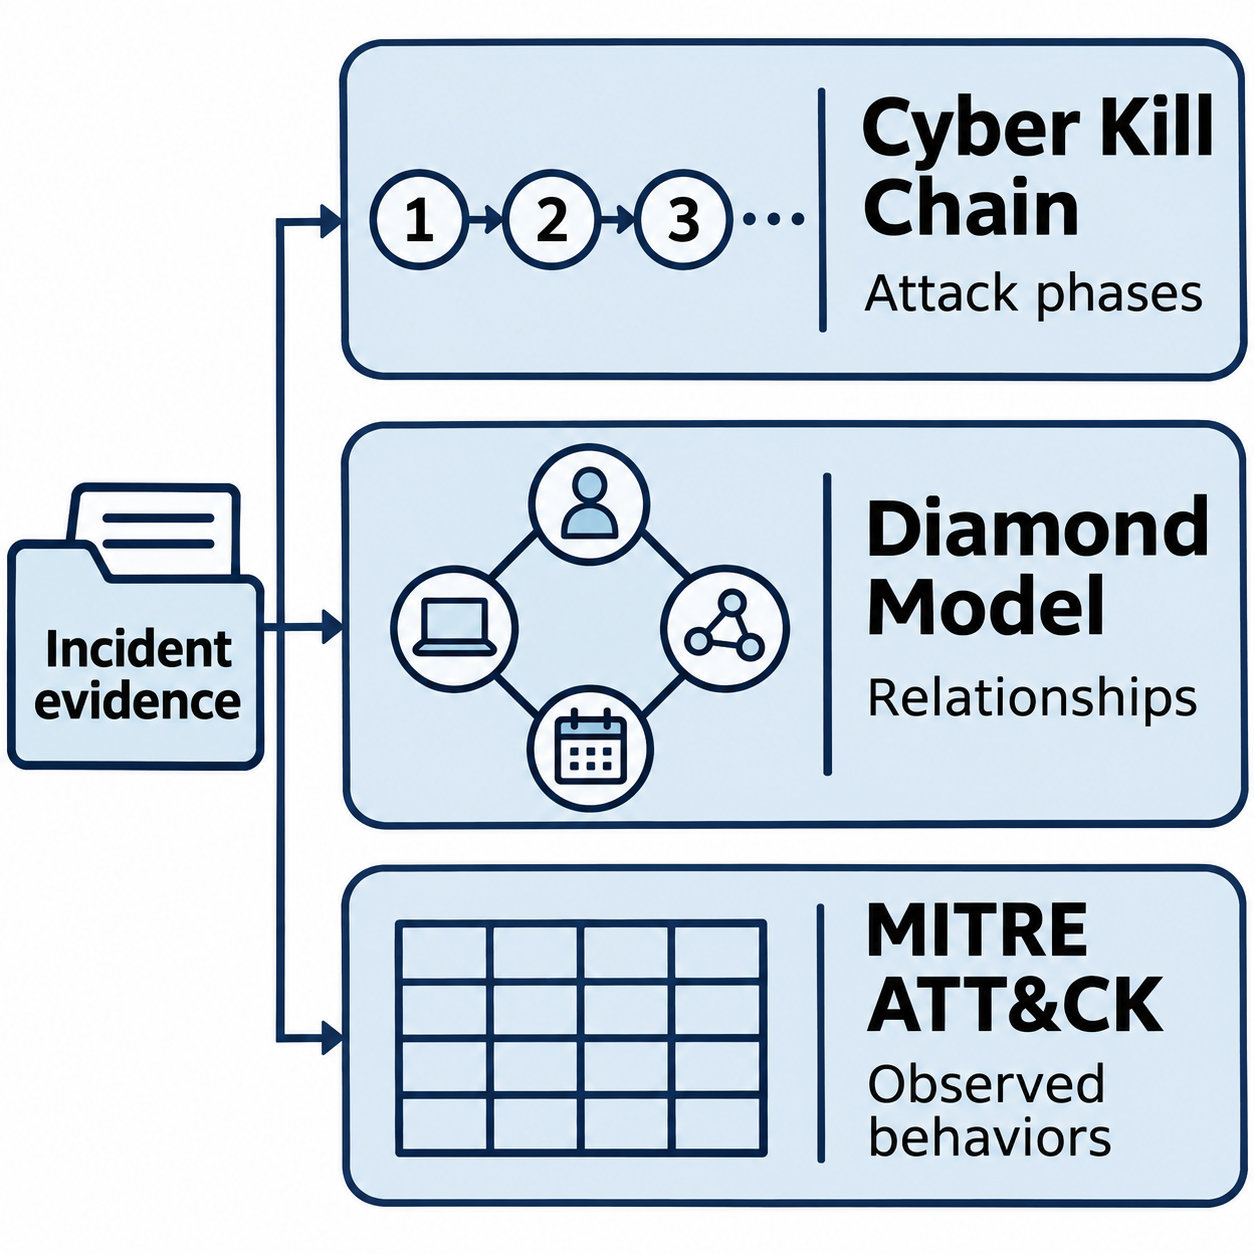
Figure 12.1: Three frameworks organize different questions about the same incident.
Text description for Figure 12.1
The Cyber Kill Chain organizes attacker activity into phases. The Diamond Model relates the adversary, capability, infrastructure, and victim. MITRE ATT&CK (Adversarial Tactics, Techniques, and Common Knowledge) classifies adversary goals and methods. Analysts can apply all three to the same records. These models organize evidence and questions, while the investigation determines which interpretations the records support.
Learning Objectives
Upon completing this chapter, students will be able to:
- Apply the Cyber Kill Chain to map attack phases and identify adversary actions in each phase.
- Analyze incidents using the Diamond Model to understand relationships between adversary, capability, infrastructure, and victim.
- Identify and classify attack techniques using MITRE ATT&CK, distinguishing tactics and techniques.
- Explain the seven-phase incident response process and understand decision points at each phase.
- Determine scope and severity of incidents using established frameworks and metrics.
12.1 The Cyber Kill Chain
The Cyber Kill Chain is a linear model of attack phases originally published by Lockheed Martin. It breaks attacks into seven sequential phases, each representing a distinct set of attacker activities and observable indicators.
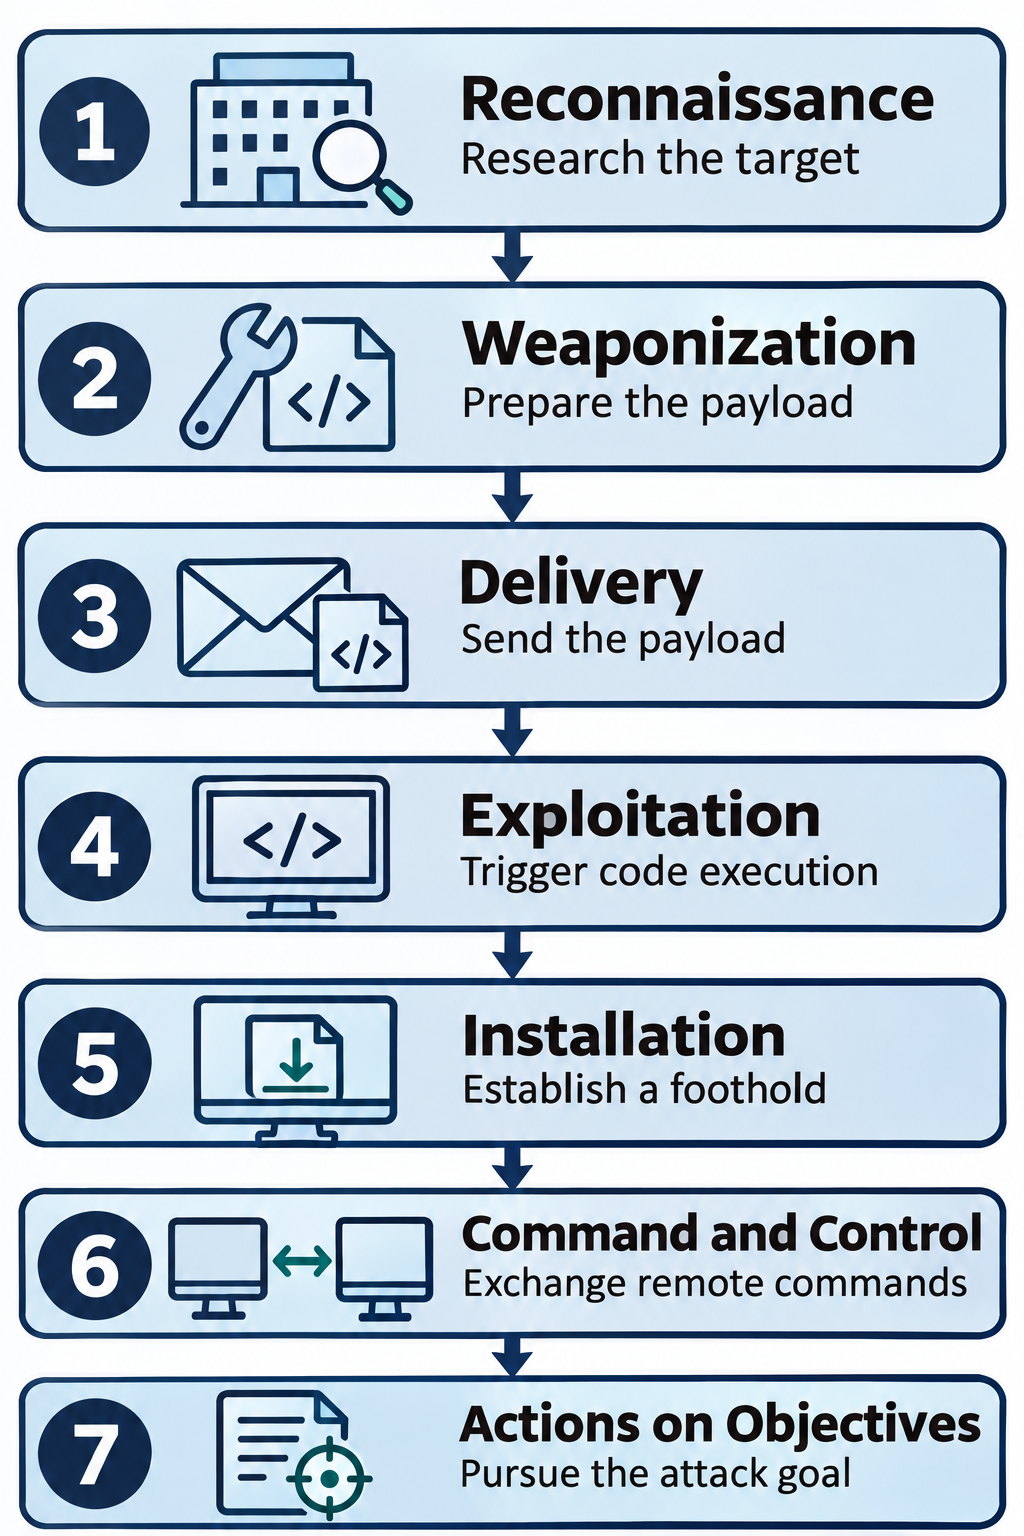
Figure 12.2: The Cyber Kill Chain arranges seven attack phases into a model that analysts can use to organize observations.
Text description for Figure 12.2
The vertical sequence reads: 1. Reconnaissance, research the target. 2. Weaponization, prepare the malicious payload, meaning the code or content intended for delivery. 3. Delivery, send the payload. 4. Exploitation, trigger code execution. 5. Installation, establish a foothold. 6. Command and Control, exchange remote commands. 7. Actions on Objectives, pursue the attack goal. The arrows express the model's phase order. An investigation may lack direct evidence of a phase, especially preparation performed outside the victim environment.
Phase 1: Reconnaissance
Reconnaissance is the research phase where the attacker gathers information about the target before attempting entry. Activities include:
- Passive information gathering: Reviewing public web pages, DNS records, WHOIS data, job postings, social media. An attacker might find employee names and email address formats from LinkedIn, enabling targeted phishing.
- Network mapping: Using tools like nslookup, whois, and shodan to identify IP ranges, domain infrastructure, and externally-facing services.
- Open-source intelligence (OSINT): Aggregating public information into a target profile. Tools like Maltego automate OSINT collection.
Observable indicators of reconnaissance:
- Unusual DNS queries for internal subdomains from external IP addresses
- Port scans against external IP ranges
- Web server scanning and banner grabbing
- Large volumes of WHOIS queries for the organization's domains and IP ranges
Phase 2: Weaponization
Weaponization is the development or acquisition of attack tools. Activities include:
- Malware development: Creating or modifying malware (trojans, worms, ransomware) for the specific target.
- Exploit development: Writing code that exploits a specific vulnerability in target software.
- Tool acquisition: Purchasing or stealing attack tools on the dark web.
- Phishing content creation: Crafting emails or documents that appear legitimate but contain malicious payload.
Weaponization is often invisible to the target. The attacker works offline, developing tools that will be deployed later.
Observable indicators are primarily forensic and post-compromise:
- Identifying the exploit used suggests the attacker had access to that exploit (developed or purchased).
- Analyzing malware determines if it is custom-built for the target or commodity malware.
Phase 3: Delivery
Delivery is the mechanism for getting the weapon into the target environment. Common delivery methods include:
- Email phishing: Sending a malicious attachment or link to employees.
- Watering hole attacks: Compromising legitimate websites visited by the target, then injecting malware that downloads to visitors.
- Supply-chain compromise: Compromising a software vendor's build system so updates contain malware. In the 2020 SolarWinds incident, attackers injected the SUNBURST backdoor during the Orion software build process. Customers who installed affected updates received the malicious component.
- Physical delivery: Leaving USB devices in parking lots or mailing infected hardware to the target. Corporate locations often receive packages containing USB devices from "attackers" as red team exercises.
Observable indicators of delivery:
- Phishing emails reaching mailboxes (captured by email gateway logs)
- Web server access logs showing visits to compromised watering hole sites
- Software update logs showing installation of compromised versions
Phase 4: Exploitation
Exploitation is the execution of the attack code against a vulnerability in target systems. Activities include:
- Code execution: Running arbitrary code on a target system, often through a vulnerable web application, unpatched service, or browser exploit.
- Memory corruption: Triggering buffer overflows or heap corruption to crash a process and inject code into its memory space.
- Privilege escalation: Once on a system, escalating from user privileges to administrator or system privileges.
The exploitation phase is where the attacker's presence becomes observable on the target system.
Observable indicators of exploitation:
- Process crash followed by unusual process execution (crash and restart attack patterns)
- Suspicious process spawning (e.g., iexplore.exe spawning cmd.exe, a living-off-the-land technique)
- Unexpected compiled code or interpreter execution
- Failed service restart attempts or process termination
Phase 5: Installation
Installation is the establishment of persistence: making sure the attacker can return to the compromised system even after reboot. Persistence mechanisms include:
- Scheduled tasks: Creating Windows scheduled tasks that run malware at startup or on a time interval.
- Registry persistence: Adding entries to Run keys (HKLM\Software\Microsoft\Windows\CurrentVersion\Run) that execute malware when a user logs on.
- Startup folders: Dropping malicious shortcut files into startup directories.
- Service installation: Creating Windows services that execute at boot.
- Cron jobs (Linux/macOS): Scheduling recurring execution of malicious scripts.
- Web shell installation: Uploading web shells (PHP, ASP.NET) to web-accessible directories, enabling remote code execution through the web server.
Observable indicators of installation:
- Unexpected scheduled tasks, registry entries, or services
- Startup folder modifications
- Web server directory listings showing suspicious files
- File creation in system startup directories with anomalous timestamps
Phase 6: Command and Control
Command and Control (C2) is the attacker's ability to remotely command the compromised system. After installation, the attacker needs communication with the compromised system to exfiltrate data, download additional payloads, or move laterally. C2 communication includes:
- Beaconing: Compromised system makes periodic outbound connections to attacker infrastructure, checking for commands.
- Reverse shells: Compromised system initiates outbound connection to attacker's server, then attacker sends commands through that connection.
- Data channels: Using legitimate services (DNS, HTTP, HTTPS) to hide C2 communication in normal-looking traffic.
Observable indicators of C2:
- Outbound connections to external IP addresses not identified as business partners
- Regular beaconing patterns (connections at fixed intervals: every 5 minutes, every hour)
- Connections to known malicious infrastructure (according to threat intelligence)
- Unusual external DNS queries or large volumes of DNS tunneling
- Connections to residential IP ranges or bulletproof hosting providers
C2 communication is often the most reliable detection point: it confirms active compromise and provides actionable indicators (IP addresses, domains) for immediate response.
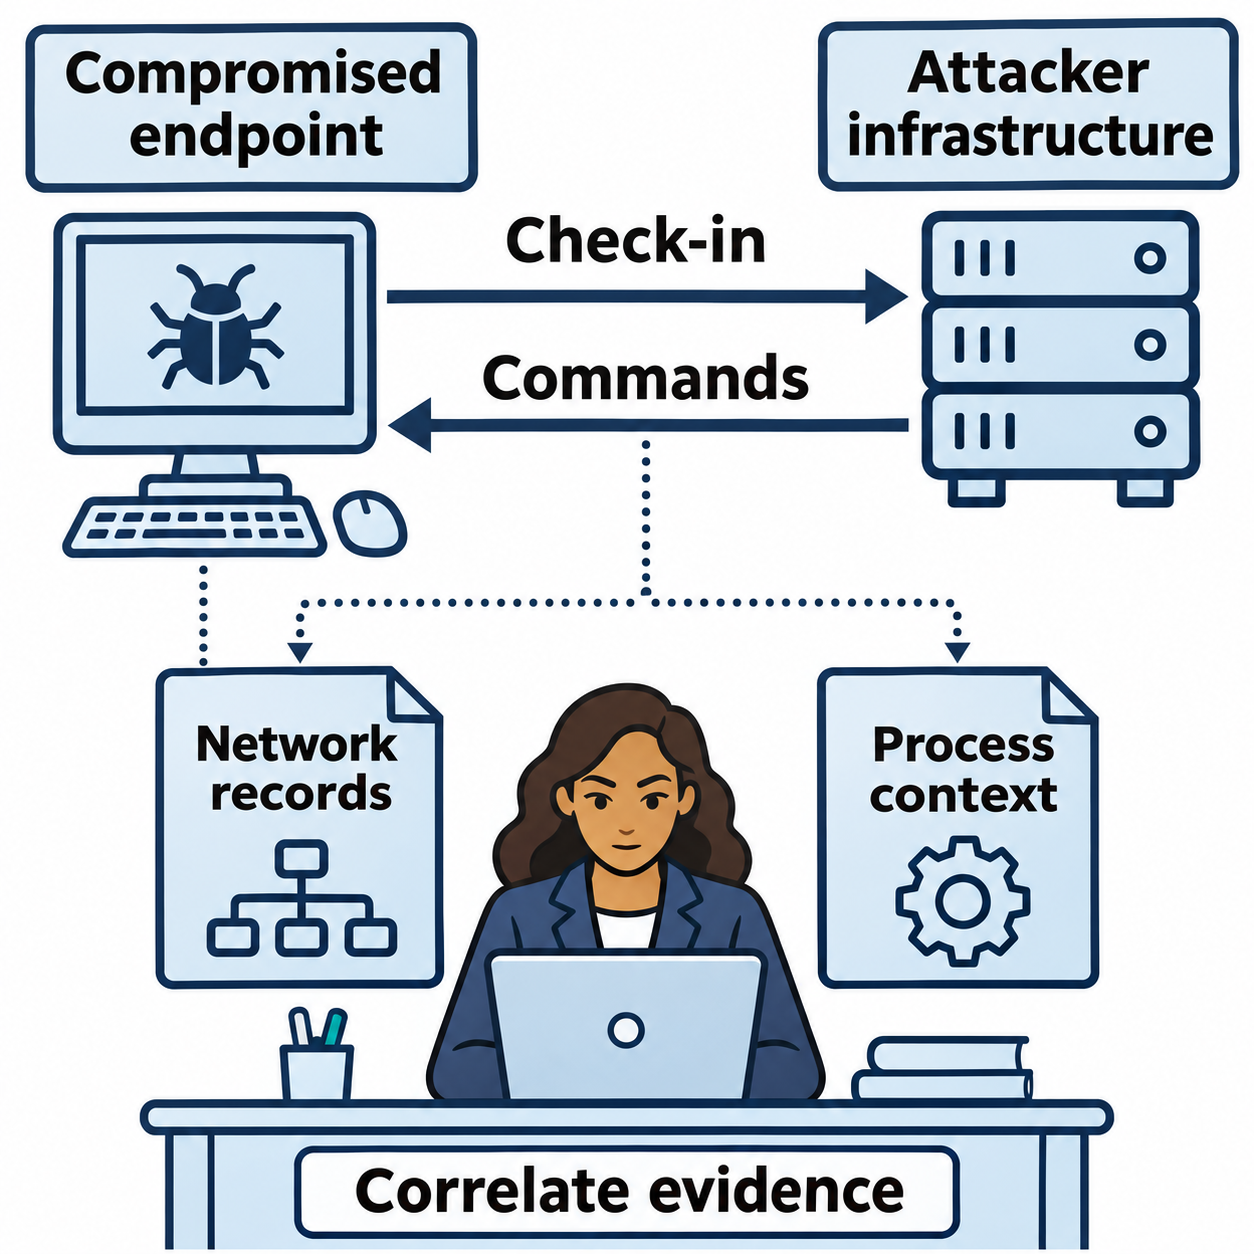
Figure 12.3: Analysts assess suspected command-and-control traffic alongside endpoint evidence.
Text description for Figure 12.3
Command and control (C2) lets an attacker direct a compromised system. The upper arrow carries an endpoint check-in toward attacker infrastructure. The lower arrow carries commands back toward the endpoint. Dotted connections identify records available for investigation, rather than additional attacker traffic. Network records describe connections, while process context helps identify the program responsible. Repeated connections alone do not establish malicious control.
Phase 7: Actions on Objectives
Actions on Objectives is the attacker's final goal: stealing data, disrupting systems, or damaging the organization. Actions vary by attacker motivation:
- Financial theft: Stealing credentials for online banking, credit cards, or cryptocurrency.
- Data exfiltration: Stealing intellectual property, customer data, or sensitive business information.
- Destruction: Deploying ransomware or wiper malware to encrypt or delete data.
- Espionage: Installing backdoors for long-term access and surveillance.
- Disruption: DDoS attacks or infrastructure destruction.
Observable indicators of actions on objectives:
- Large outbound data transfers to external destinations
- Encryption of files across the file system (ransomware)
- Unexpected system outages or service disruptions
- Database exports or backups being copied to attacker infrastructure
- Modification of security settings or deletion of logs
12.2 The Diamond Model of Intrusion Analysis
The Diamond Model complements the Cyber Kill Chain by focusing on relationships between four core elements of any intrusion: adversary, capability, infrastructure, and victim.
Core Vertices
Adversary represents the human actor (threat group, individual, nation-state) carrying out the attack. Multiple adversaries can operate similarly (using same tools, targeting same industries), so attribution is complex.
Capability is the skill, tool, or technique the adversary uses. Capabilities include malware, exploits, social engineering techniques, or operational tradecraft.
Infrastructure is the attacker's hardware and software: command-and-control servers, malicious domains, hosting providers, compromised intermediate systems.
Victim is the targeted organization or individual.
The Diamond
The core diamond relationship connects these four elements:
            Adversary
            /       \
           /         \
      Capability - Infrastructure
           \         /
            \       /
             Victim
This model emphasizes that attacks are better understood as relationships than as isolated events. An adversary uses specific capabilities through specific infrastructure to attack specific victims.
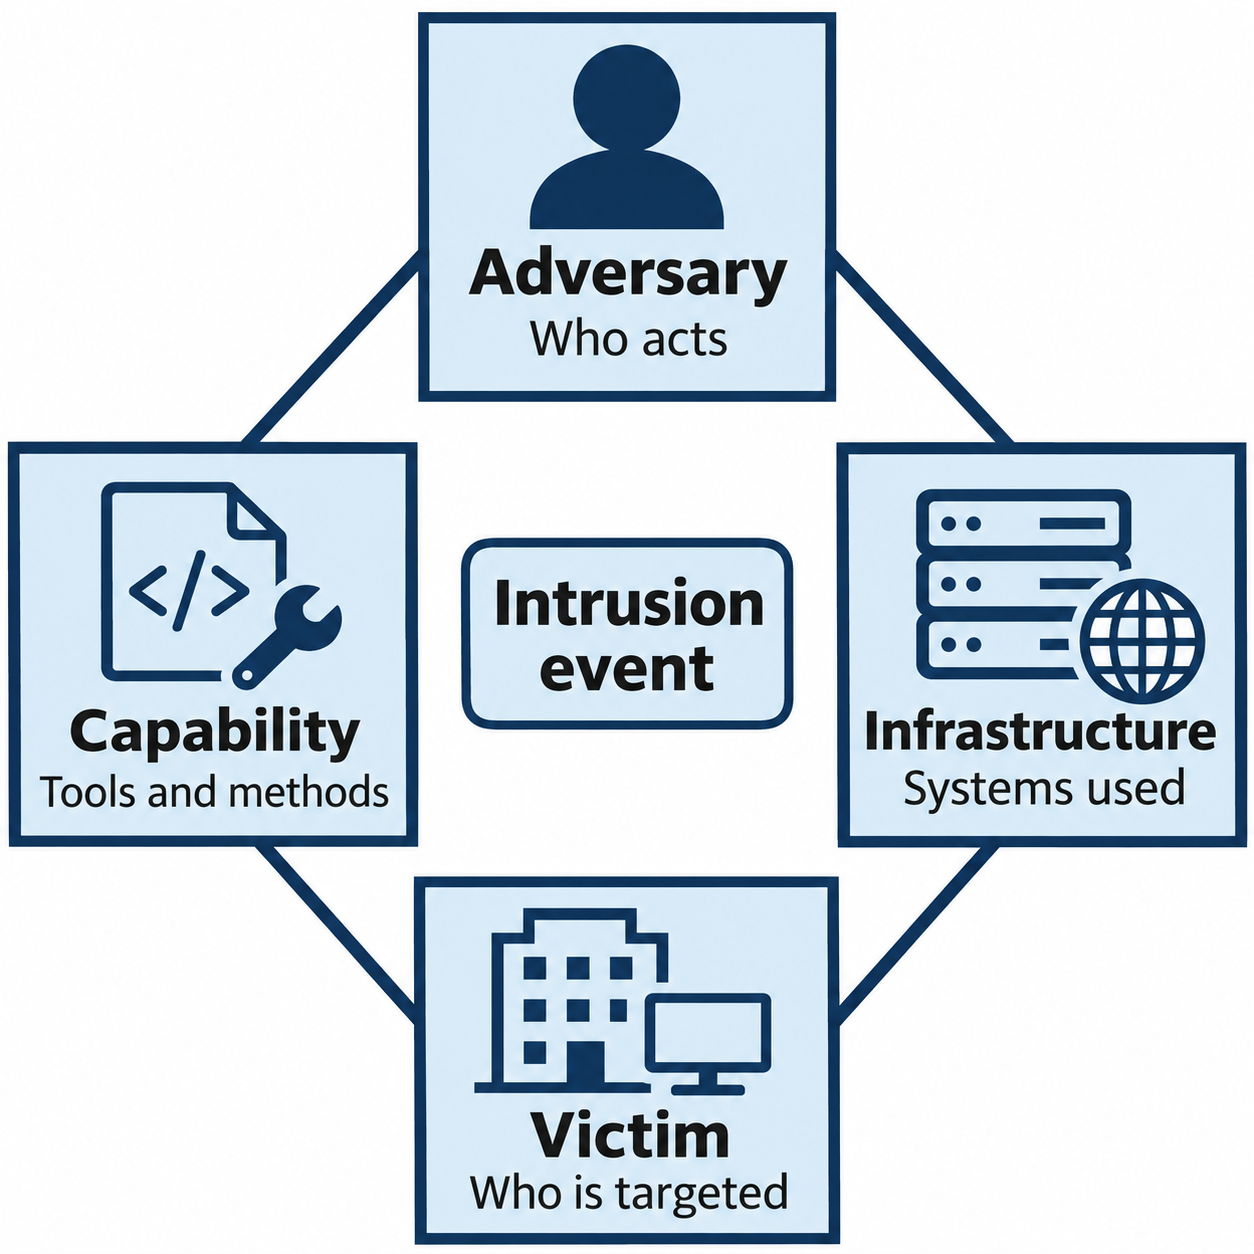
Figure 12.4: The Diamond Model connects four features of an intrusion event.
Text description for Figure 12.4
The top vertex is the adversary, the actor behind the activity. The left vertex is capability, the tools and methods used. The right vertex is infrastructure, the systems used to carry out the activity. The bottom vertex is the victim, the person or organization targeted. The edges connect related features of one event. They do not specify a sequence of attack phases. Analysts can record unknown features and refine them as evidence develops.
Reference: Diamond Model paper.
Diamond Model Extensions: Overlaps and Relationships
The Diamond Model extends to show how different adversaries, capabilities, infrastructure, and victims overlap:
- Adversary overlap: The same threat group might conduct multiple intrusions against different organizations.
- Capability overlap: Different threat groups might use the same tool, such as Mimikatz for credential theft, or exploit the same vulnerability.
- Infrastructure overlap: Attacker A and Attacker B might both use the same bulletproof hosting provider.
- Victim overlap: The same organization might be targeted by multiple threat groups.
Understanding overlaps helps analysts answer questions like: "We detected a technique associated with APT28, but is it really APT28 or a copycat using open-source tools?" Overlaps suggest it might be a copycat.
Activity Threads and Activity Groups
Activity threading connects causally related intrusion events across attack phases. Analysts examine how one event enables or leads to another. For example, a phishing attachment launches malware, the malware steals an account's credentials, and the attacker uses those credentials to access another system. Records linking the attachment, malware execution, credential theft, and subsequent login support an activity thread. Analysts record gaps and uncertainty where the causal links remain unconfirmed.
An activity group collects events or activity threads with shared characteristics, such as infrastructure, tools, or targeted organizations. For example, analysts might provisionally group incidents at two organizations because both involve the same malicious domain and similar malware. Shared characteristics provide leads for further investigation. Analysts need additional evidence to establish a common campaign or attribute the activity to a particular threat group. Figure 12.5 illustrates this comparison across incidents.
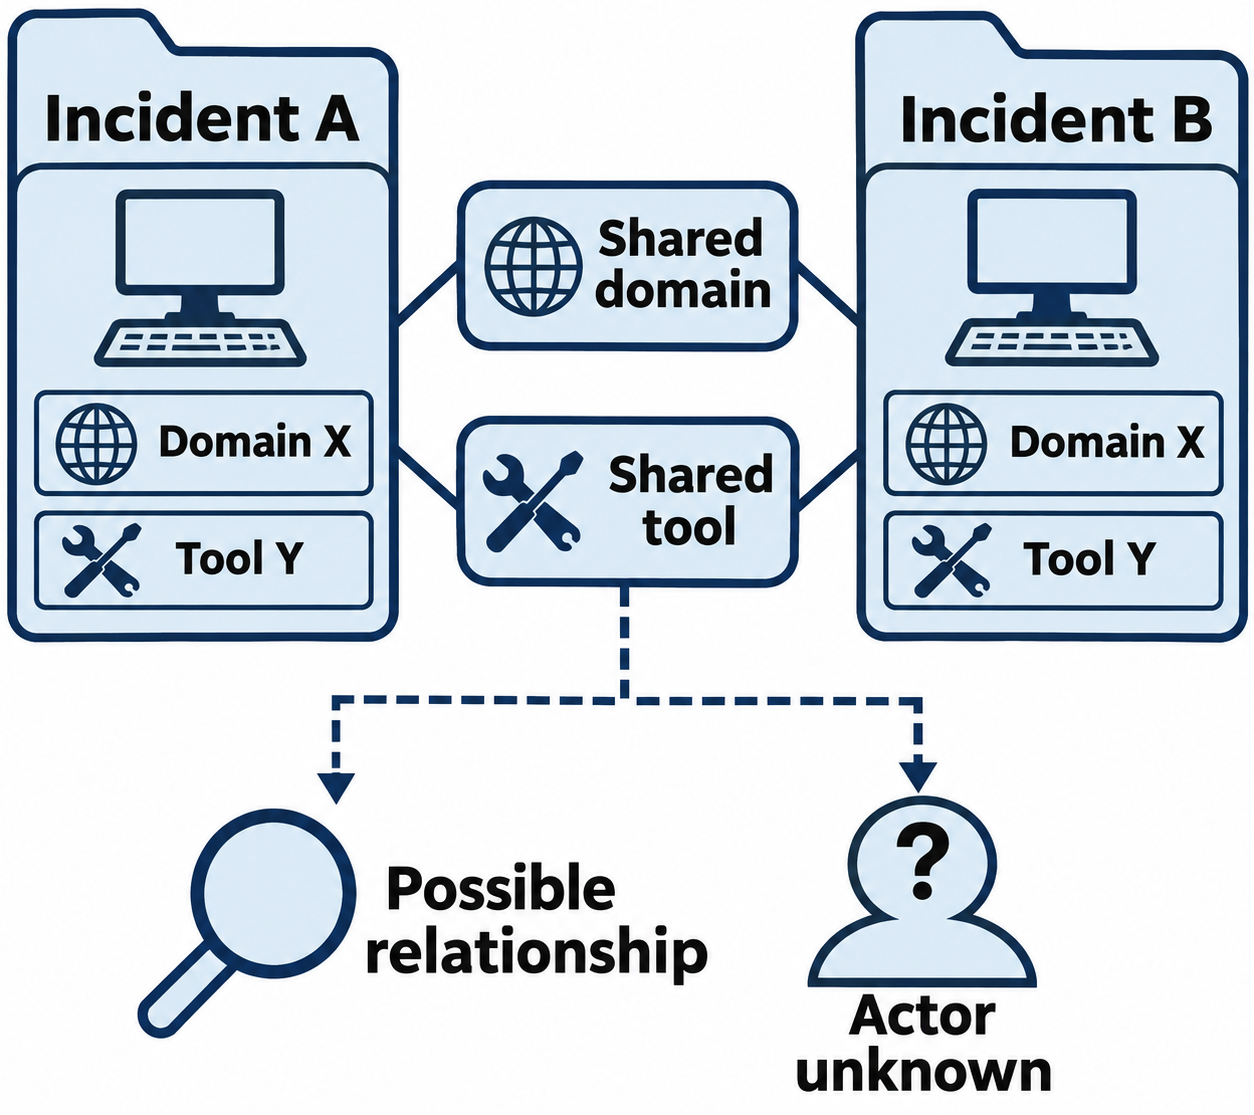
Figure 12.5: Synthetic example: shared infrastructure and tools provide leads for comparing incidents.
Text description for Figure 12.5
Incident A and Incident B each contain observations of the fictional Domain X and Tool Y. Solid lines identify the overlapping evidence. The dashed connection marks a possible analytical relationship that requires further support. Shared infrastructure can serve unrelated users, and multiple actors can reuse tools. Analysts compare timing, behavior, and other evidence before grouping activity or assigning an actor. The labels represent a teaching example, not a real domain, tool, or campaign.
12.3 MITRE ATT&CK Framework
Chapter 4 covered the structure of MITRE ATT&CK and the use of heatmaps to visualize detection coverage and gaps. This section builds on that foundation by focusing on how analysts use ATT&CK during incident response to interpret evidence and guide investigation and response decisions.
The MITRE ATT&CK framework is a comprehensive, adversary-agnostic knowledge base of techniques used by real-world threat actors. Unlike the Cyber Kill Chain (which is linear and sequential), ATT&CK is a matrix that maps tactics (high-level goals) to techniques (specific methods).
This chapter uses Enterprise ATT&CK v19. In the v19 release, MITRE split the former Defense Evasion tactic into Stealth and Defense Impairment.
Tactics
Tactics describe the goals an attacker seeks to achieve. Enterprise ATT&CK v19 includes the following 15 tactics:
| Tactic | Description |
|---|---|
| Reconnaissance | Gather information about the target before attacking |
| Resource Development | Build capabilities: create infrastructure, obtain domains, develop malware |
| Initial Access | Establish entry point into the network |
| Execution | Run code on compromised systems |
| Persistence | Ensure ability to return to compromised system after reboot |
| Privilege Escalation | Obtain higher privileges on compromised system |
| Stealth | Conceal activity by blending in with legitimate behavior or reducing observable signals while defensive systems remain intact |
| Defense Impairment | Weaken, disable, or tamper with security controls and monitoring mechanisms |
| Credential Access | Steal or compromise user/system credentials |
| Discovery | Identify systems, software, accounts on the target network |
| Lateral Movement | Move from compromised system to other systems on the network |
| Collection | Gather data from the target |
| Command and Control | Establish communication channel with compromised systems |
| Exfiltration | Transfer stolen data out of the organization |
| Impact | Destroy, disrupt, or degrade systems or data |
For example, Stealth includes giving a malicious program a name that resembles a legitimate application while security tools continue operating. Defense Impairment includes disabling event logging or stopping a security tool. During incident response, this distinction helps analysts assess both concealed activity and damage to the systems used to detect it.
Techniques
Techniques are specific methods an attacker uses to achieve a tactic. For example, the "Persistence" tactic includes dozens of techniques:
- Registry Run Keys (T1547.001): Add entries to Windows registry Run keys that execute when a user logs on
- Scheduled Task/Job (T1053): Use operating system job scheduling functionality (cron, Windows Task Scheduler) to execute code periodically
- Web Shell (T1505.003): Install web shells on web servers for persistent remote access
- System Firmware (T1542.001): Modify the firmware that initializes a computer before its operating system loads to maintain persistence
Each technique is tagged with an identifier (T1547.001) for reference.
Sub-techniques
Some techniques have sub-techniques that provide additional specificity. For example, "Scheduled Task/Job" (T1053) has sub-techniques for specific schedulers:
- T1053.005: Scheduled Task (Windows)
- T1053.003: Cron (Linux/macOS)
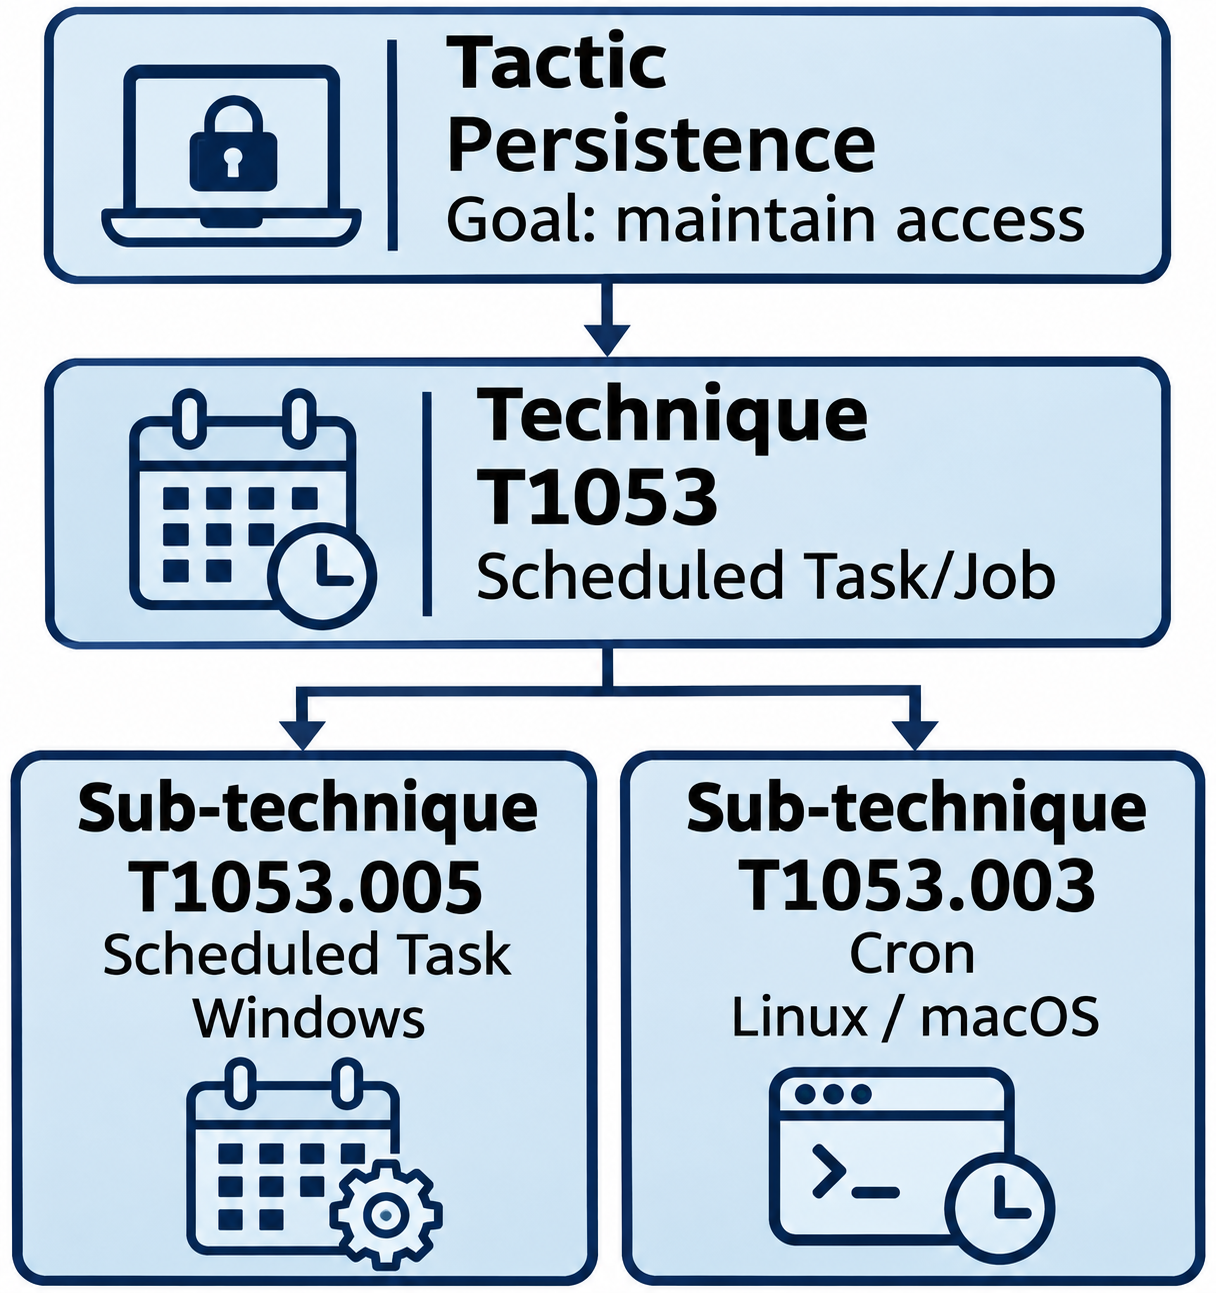
Figure 12.6: An ATT&CK tactic describes a goal, a technique describes a method, and a sub-technique identifies a more specific method.
Text description for Figure 12.6
This example starts with Persistence, the goal of maintaining access. Scheduled Task/Job, T1053, describes abusing operating-system scheduling. Its examples include Scheduled Task, T1053.005, for Windows and Cron, T1053.003, for Linux or macOS. The connector shows classification from general to specific. This is one tactic relationship for the technique, which can also support other goals. MITRE lists Cron as T1053.003 and Systemd Timers as T1053.006.
Reference: MITRE Scheduled Task/Job reference.
ATT&CK for Incident Response
During incident response, analysts use ATT&CK to:
- Classify observed behavior: "We observed scheduled task creation. That maps to T1053.005."
- Identify attack objectives: "The attacker created a persistence mechanism (T1053), suggesting they intend to maintain long-term access."
- Link to threat actors: "T1053.005, T1087 (Account Discovery), and T1021 (Remote Services) are techniques commonly used by APT28. Our incident may be APT28."
- Develop response priorities: "The attacker is using a protocol on an unusual port for C2 (T1571: Non-Standard Port). Response must prioritize isolation and C2 disconnection."
- Improve detection: "Abuse Elevation Control Mechanism (T1548) is a technique used for privilege escalation. We should ensure EDR alerting on this behavior is tuned."
During an incident, analysts can use ATT&CK Navigator to map the techniques and sub-techniques identified in the incident timeline. A Navigator layer is a customizable view of an ATT&CK matrix. An incident-specific layer can highlight observed behaviors and attach comments to the corresponding techniques as evidence emerges.
For each mapping, comments can record the related timeline entry, event time and time zone, affected host or account, supporting evidence, and the reason for choosing that technique. Analysts should select a sub-technique when the evidence supports that level of detail. A documented color legend can distinguish confirmed behavior from tentative mappings, with the status also written in comments.
The incident timeline preserves the order and repetition of events. The Navigator layer groups mapped behaviors by tactic and helps analysts summarize findings, identify follow-up questions, and communicate across shifts. Teams can revise the layer as findings change and save the layer file with the incident documentation. MITRE's Navigator usage guide explains layers and annotations.
Analyst Perspective
ATT&CK is not a lockstep framework like the Kill Chain. Attackers do not necessarily follow every tactic in order. Some attacks skip credential theft entirely (using exploits instead). Some attacks move laterally without privilege escalation. ATT&CK is best used as a taxonomy to classify what you observe, not a checklist of expected attack phases.
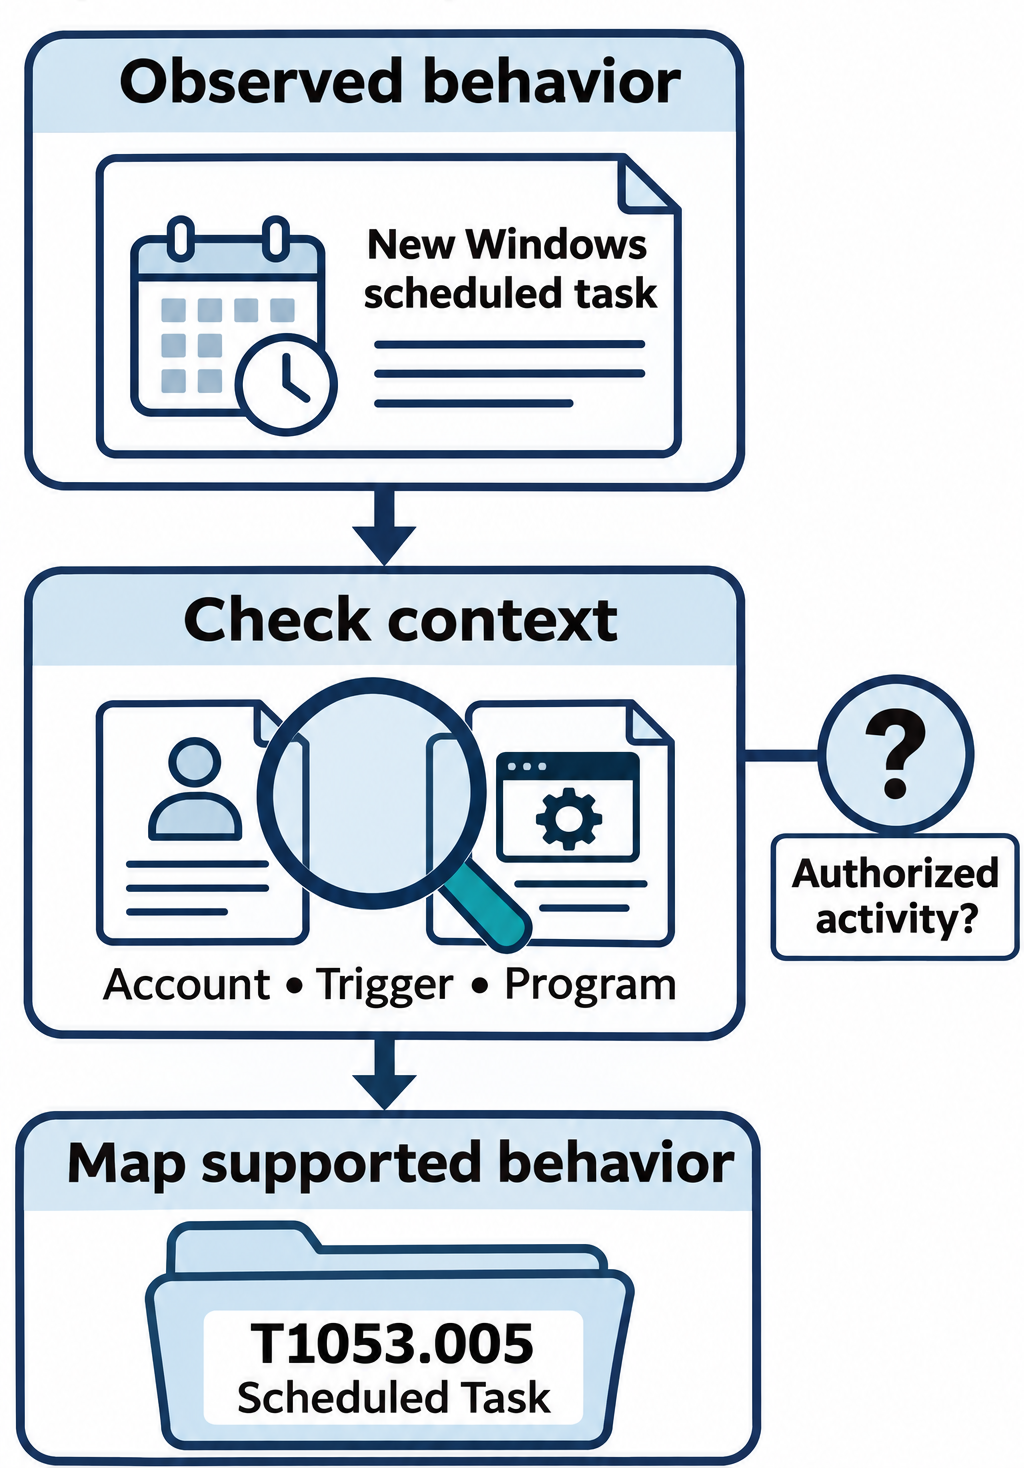
Figure 12.7: Synthetic example: examine task details and authorization before classifying observed behavior.
Text description for Figure 12.7
A fictional investigation begins with a record of a newly created Windows scheduled task. The analyst checks the account that created or runs it, the trigger that starts it, the program it launches, and whether the activity was authorized. When evidence supports adversarial use of Windows Task Scheduler, the behavior maps to Scheduled Task, T1053.005. Routine administration also creates scheduled tasks. A technique label describes behavior and does not establish a threat actor's identity.
Reference: MITRE Scheduled Task reference.
12.4 The Incident Response Process
Incident response is the coordinated effort to detect, analyze, contain, eradicate, and recover from security incidents. The industry-standard incident response process has seven phases (per NIST SP 800-61):
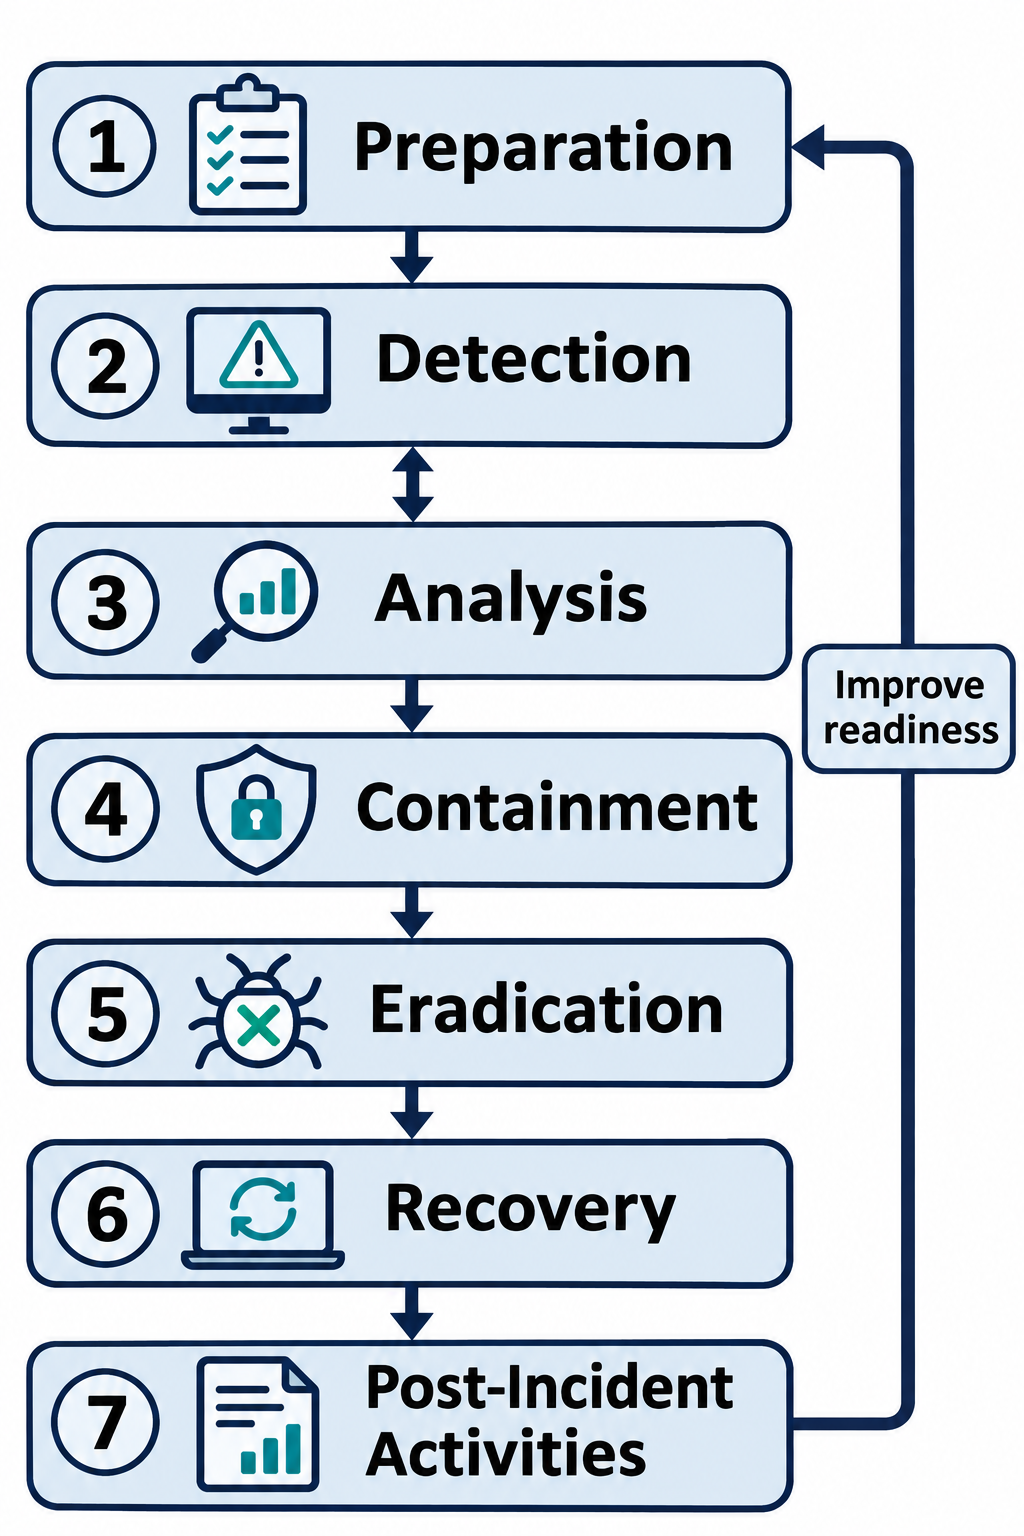
Figure 12.8: This chapter's seven-part teaching workflow connects response activities with improvements to preparation.
Text description for Figure 12.8
The sequence follows this chapter's teaching structure: prepare capabilities, detect potential incidents, analyze evidence, contain damage, eradicate attacker access, recover operations, and review the incident. Detection and analysis exchange information. Post-incident findings improve preparation. Activities can overlap or repeat as evidence changes. The seven labels represent the chapter's expanded teaching sequence. National Institute of Standards and Technology (NIST) Special Publication 800-61 Revision 3 organizes incident response around Detect, Respond, and Recover, supported by broader risk-management activities.
Reference: NIST SP 800-61 Revision 3.
Phase 1: Preparation
Preparation is the foundation that enables all subsequent phases. It includes:
- Tools and infrastructure: Deploying EDR, SIEM, logging systems, and threat intelligence platforms.
- Policies and procedures: Establishing incident response plans, escalation procedures, and communication protocols.
- Team training: Ensuring analysts understand incident response procedures and their roles.
- Playbooks and runbooks: Documenting standard response procedures for common incident types.
- Isolation and recovery capabilities: Ensuring the organization can safely isolate compromised systems and restore from clean backups.
Many organizations discover during incident response that they lack fundamental preparation (no EDR deployed, no clean backups, no incident response team identified). Preparation prevents these gaps.
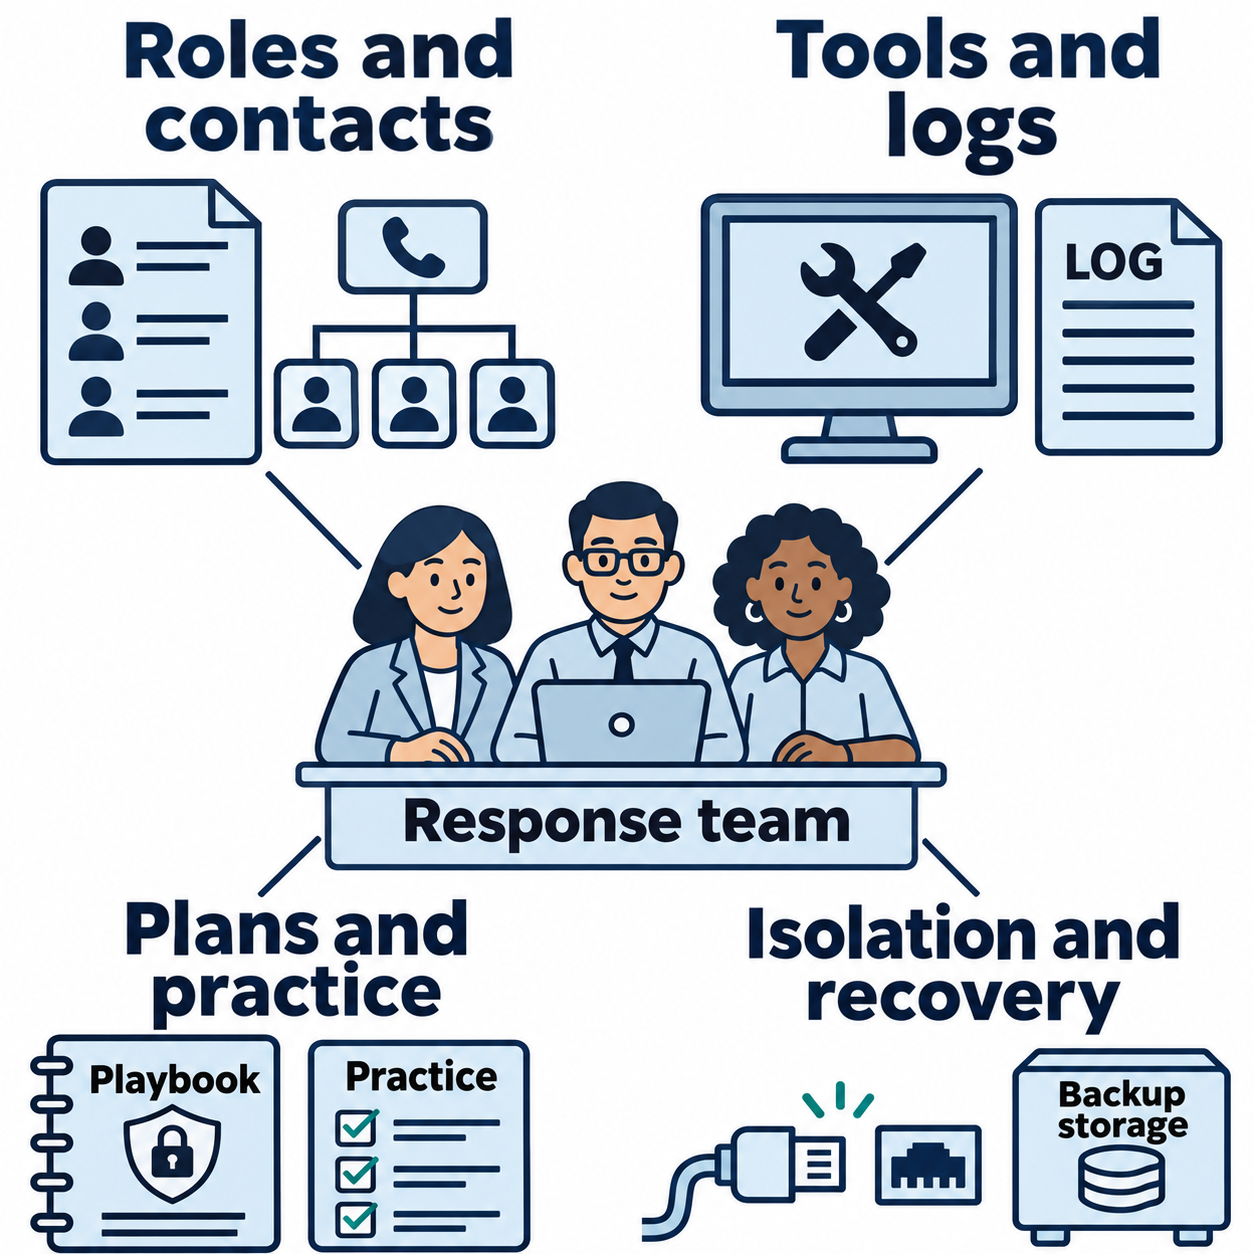
Figure 12.9: Preparation gives the response team the people, records, procedures, and recovery capabilities it will need.
Text description for Figure 12.9
Four connected capabilities support the team. Roles and contacts establish responsibilities and communication paths. Tools and logs support observation and investigation. Plans and practice provide documented actions and opportunities to rehearse them. Isolation and recovery capabilities let the team restrict affected systems and restore operations. The illustration shows preparation categories rather than a particular product or a complete readiness assessment.
Phase 2: Detection
Detection identifies that something is wrong. Detection sources include:
- Automated systems: SIEM rules, EDR alerts, network-based intrusion detection.
- Human observations: Employees noticing unusual activity, help desk reporting suspicious logins, system administrators discovering unexpected files.
- External reports: Security vendors alerting customers to new threats, law enforcement notifying of compromises, third-party organizations detecting activity targeting you.
- Threat hunting: Proactive analysts searching logs for indicators of compromise.
The effectiveness of incident response depends on detection timeliness. The longer an attacker operates undetected, the more damage they cause.
Detection Gap
Statistics consistently show that organizations detect breaches months after compromise. The Verizon Data Breach Investigations Report (DBIR) reports median detection times of 200+ days for many breach types. This implies attackers operate for months before detection, causing extensive damage. Early detection is critical and requires investing in detection infrastructure.
Phase 3: Analysis
Analysis is the investigation phase in which the incident response team establishes incident scope: the affected systems, accounts, data, and business services, the extent of the attacker's access, and the period of activity. The team answers:
- What happened? Reconstruct the timeline and sequence of events.
- How did the attacker enter? Identify the initial access point and methodology.
- How long have they been here? Determine time of compromise.
- What systems are affected? Inventory compromised systems.
- What was accessed or stolen? Determine scope of data exposure.
- Are they still active? Is the attacker still accessing systems, or have they been disconnected?
- What is the attacker's objective? Is this espionage, financial theft, disruption, or ransomware?
Analysis uses all available data: EDR logs, SIEM logs, endpoint artifacts (registry, file system), network traffic captures, email logs, and threat intelligence. The analysis timeline is critical: every hour of delay increases the attacker's opportunity to cause damage.
The team must understand the incident's scope well enough to select appropriate containment actions in the next phase. This assessment guides which systems to isolate, which accounts to restrict, and which business operations those actions could disrupt. For example, isolating one compromised workstation may leave the attacker active on other systems reached through a stolen account. Analysts update the scope as new evidence emerges. When activity is causing ongoing harm, urgent containment can begin while analysis continues.
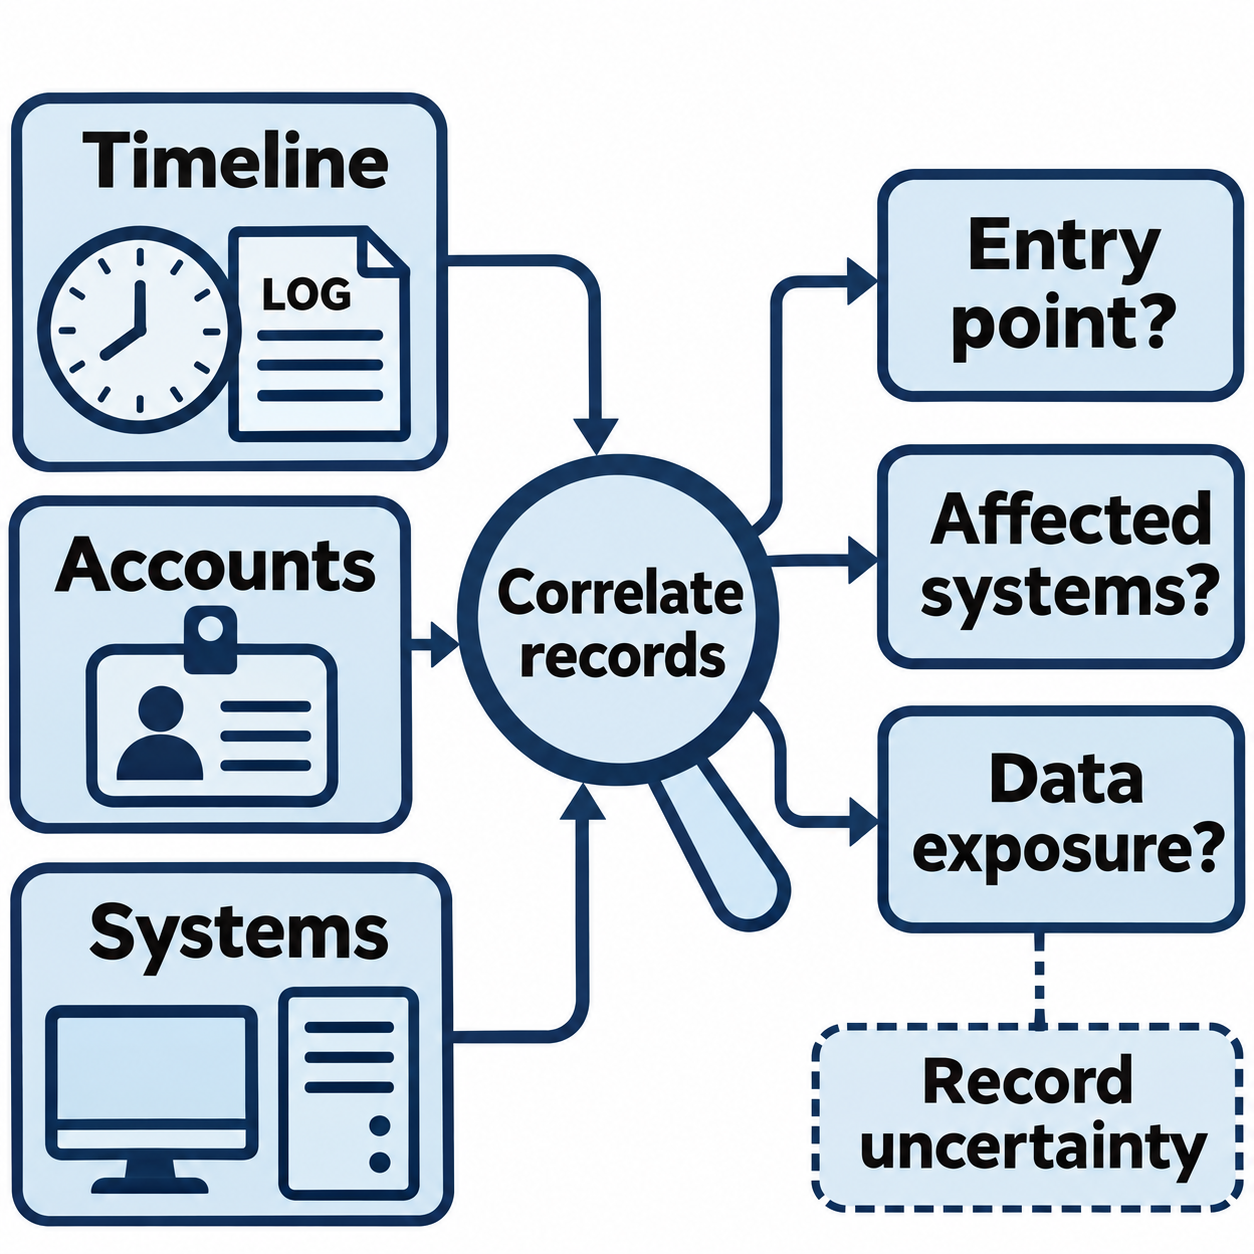
Figure 12.10: Analysis combines records to determine the entry point, affected systems, and possible data exposure.
Open Figure 12.10 at full size
Text description for Figure 12.10
The analyst relates timestamps, account activity, and system records. These comparisons help reconstruct events and assess which entry path, systems, and data are involved. Correlation means examining how records relate, including their timing and context. Each output remains a question until the available evidence supports an answer. Record uncertainty and gaps in coverage, including whether observed access establishes that data actually left the environment.
Phase 4: Containment
Containment stops the attacker's activity and prevents further damage. Containment has two aspects:
Short-term containment (tactical): - Disconnect compromised systems from the network to prevent lateral movement. - Disable compromised user accounts to prevent unauthorized access. - Block malicious IP addresses and domains at the firewall. - Reset credentials for accounts accessed by the attacker.
Long-term containment (strategic): - Patch the vulnerability that enabled initial access. - Harden systems to prevent re-compromise. - Update firewall rules to block attacker infrastructure.
Containment requires decisions on scope and impact. Isolating a single compromised workstation is low-impact. Isolating an entire business unit is high-impact but necessary if the compromise is severe.
Phase 5: Eradication
Eradication removes the attacker's presence from the environment. Activities include:
- Malware removal: Using antivirus, YARA rules, or manual removal to delete malware.
- Persistence removal: Deleting scheduled tasks, registry entries, web shells, and other persistence mechanisms.
- Access revocation: Forcing password resets, revoking API keys, and disabling compromised accounts.
- Credential rotation: Changing passwords for systems the attacker accessed.
- Vulnerability patching: Applying security updates to prevent the same exploit from being used again.
Eradication is complete only when all attacker tools, data, and persistence mechanisms are removed. Incomplete eradication leaves backdoors, allowing re-compromise weeks or months later.
Phase 6: Recovery
Recovery is the restoration of affected systems to normal operations. Activities include:
- System restoration: Restoring systems from clean backups or rebuilding from scratch.
- Data restoration: Recovering data from backups.
- Testing: Verifying systems function correctly before returning to production.
- Gradual return: Bringing systems online gradually while monitoring for signs of re-compromise.
Recovery assumes a clean backup is available. Organizations without backups face difficult choices: rebuild systems from scratch (time-consuming and resource-intensive) or try to remediate in-place (risky and potentially ineffective).
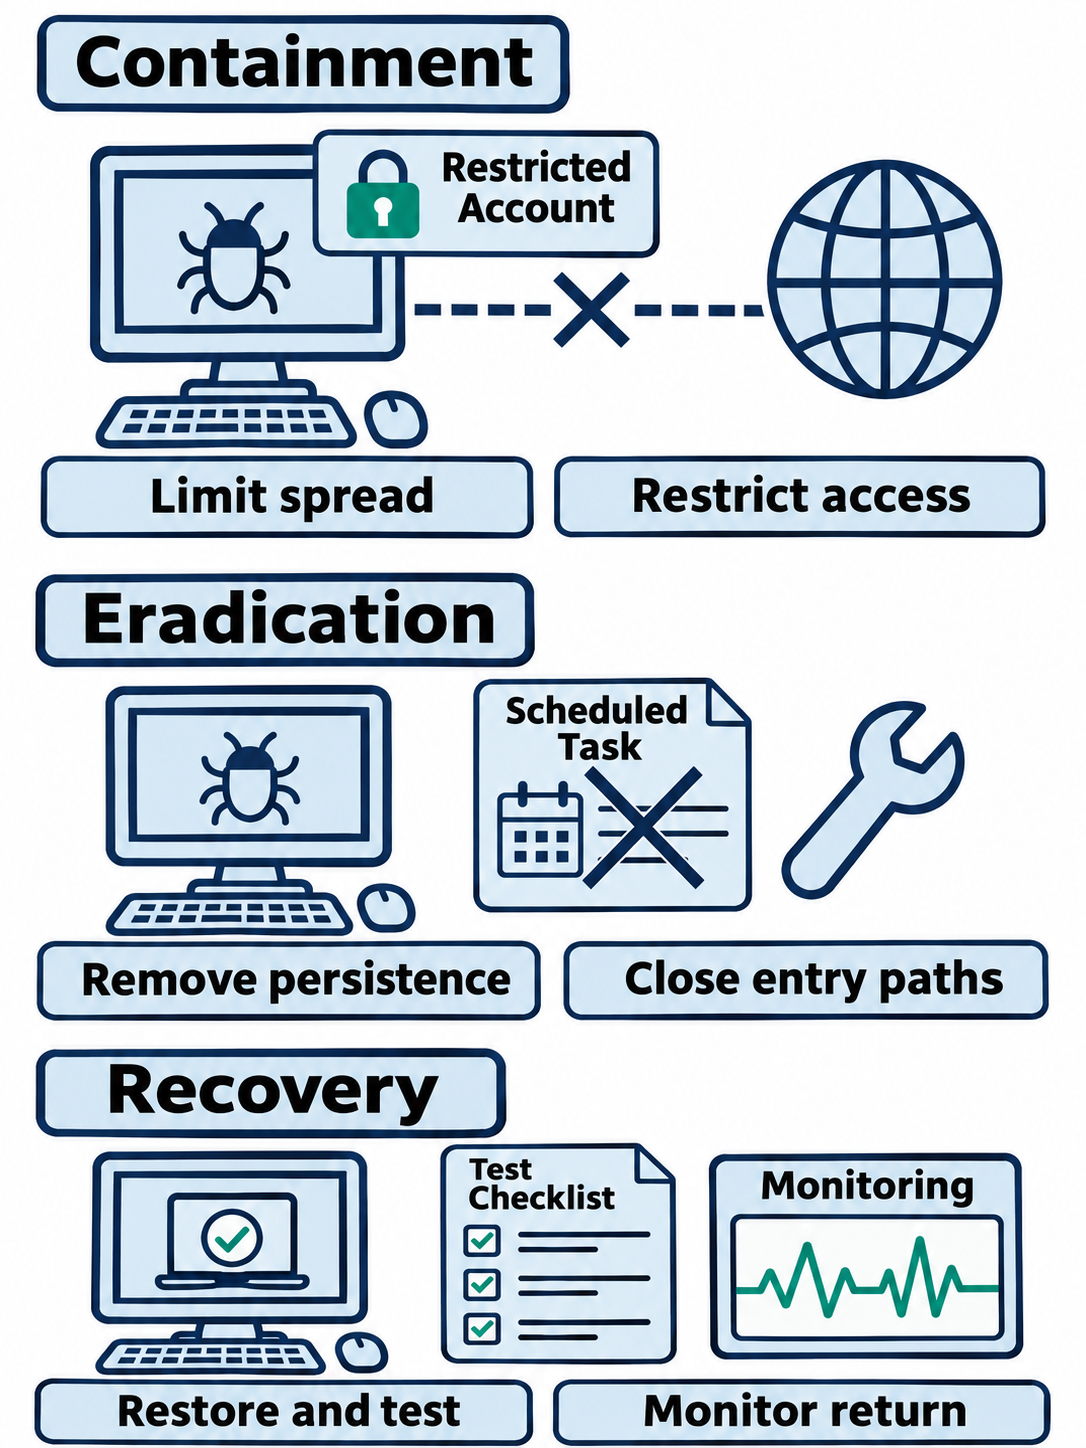
Figure 12.11: Containment limits damage, eradication removes attacker access, and recovery restores verified operations.
Open Figure 12.11 at full size
Text description for Figure 12.11
Containment restricts network paths or accounts to limit further activity. The first scene shows an interrupted connection and a restricted account. Eradication removes malicious mechanisms and addresses the paths that allowed entry. The crossed-out task illustrates removal of one persistence mechanism, not proof that the entire environment is clean. Recovery restores or rebuilds systems, tests their function and security, and monitors their return to service. These activities can overlap as the investigation develops.
Phase 7: Post-Incident Activities
Post-incident activities occur after the incident is contained and systems are recovered. Activities include:
- Documentation: Documenting the incident timeline, affected systems, and actions taken.
- Root cause analysis: Understanding how the compromise occurred and what controls failed.
- Lessons learned: Identifying process improvements, tool gaps, and training needs.
- Metrics collection: Quantifying the incident (time to detection, time to containment, systems affected, data lost, cost).
- Communication: Reporting findings to management, customers, and potentially regulators.
Post-incident analysis directly improves incident response maturity. Organizations that skip this phase repeat mistakes.
12.5 Putting It Together: SolarWinds Supply-Chain Compromise
Incident: In December 2020, researchers discovered that Orion, the network management platform by SolarWinds, contained a backdoor. The backdoor was inserted into legitimate SolarWinds software during the build process, meaning that all customers who updated to affected versions (released in March-June 2020) received malware disguised as legitimate updates.
SolarWinds' May 2021 investigation update stated that the company could not determine precisely how the attackers first gained access to its environment. Phishing was one possible entry method under consideration.
The number of customers who downloaded affected updates also differed from the number who experienced subsequent attacker activity. In its May 2021 filing with the US Securities and Exchange Commission (SEC), SolarWinds explained that up to 18,000 customers downloaded potentially vulnerable versions. Some never installed them, and some installed them on servers without internet access. The company estimated that fewer than 100 customers were actually hacked through SUNBURST. That figure was the company's estimate at the time.
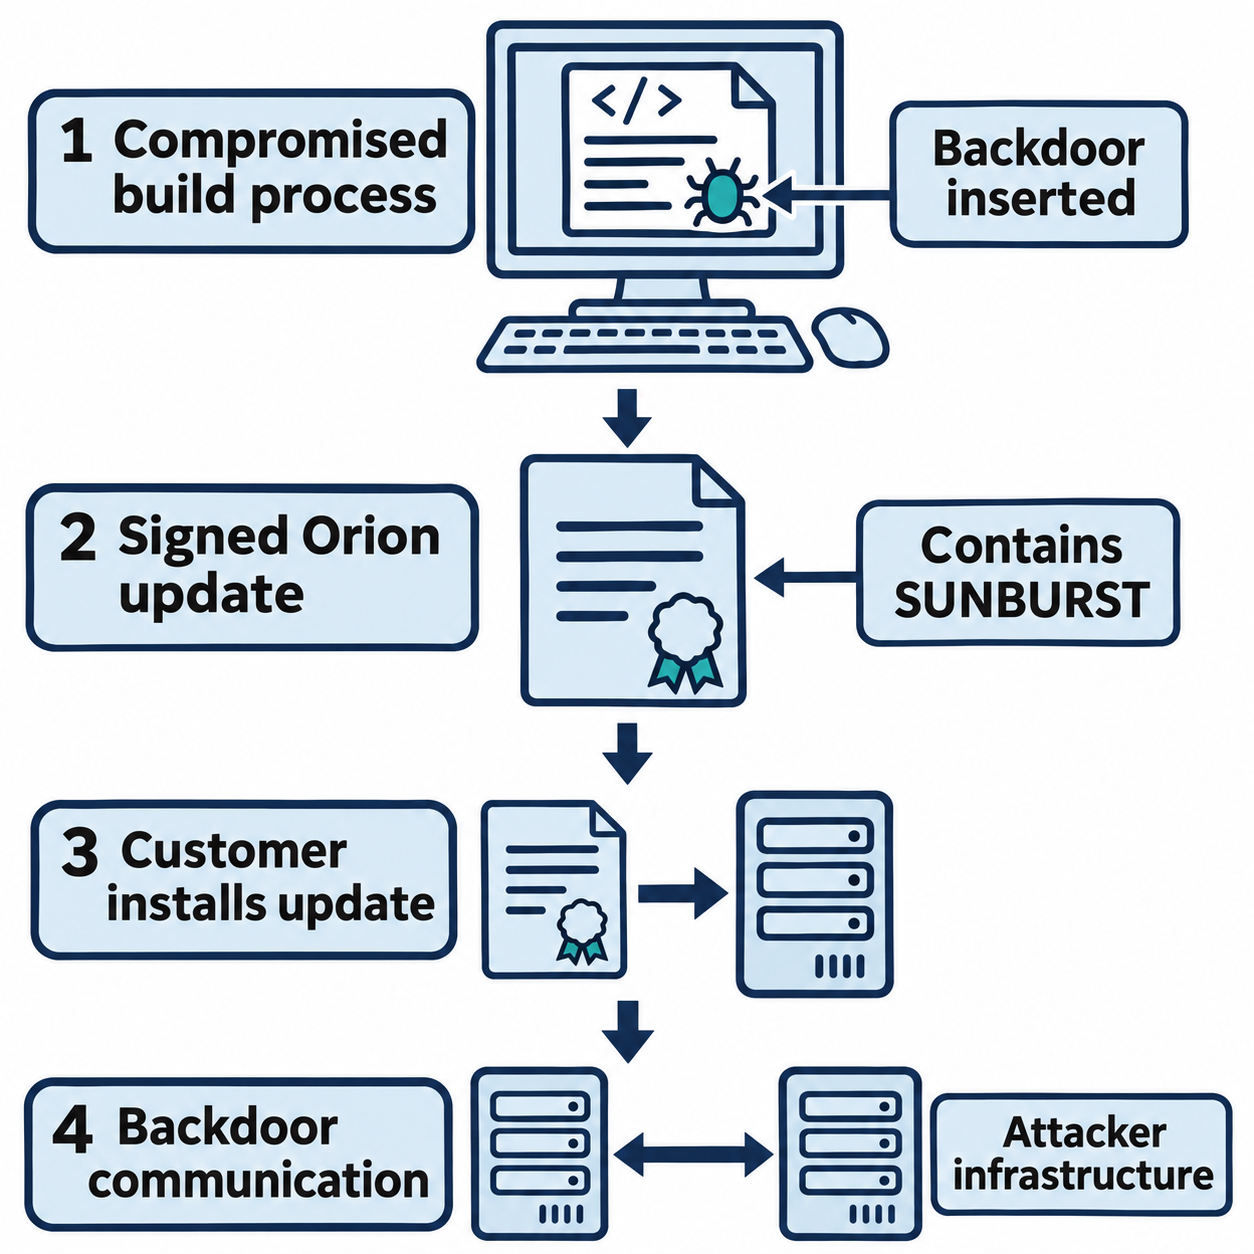
Figure 12.12: SUNBURST reached customers through compromised, digitally signed SolarWinds Orion updates.
Open Figure 12.12 at full size
Text description for Figure 12.12
The four illustrated stages summarize the delivery mechanism. First, the attacker compromises the software build process and inserts a backdoor. Second, the affected Orion update contains SUNBURST and carries a digital signature. Third, a customer installs the affected update. Fourth, the backdoor can communicate with attacker infrastructure. The signature identifies the signed software artifact but does not establish that its contents are safe. This conceptual figure does not show victim totals or imply that every recipient experienced the same follow-on activity.
Reference: FireEye SUNBURST report.
Kill Chain Analysis
-
Reconnaissance: The attackers researched SolarWinds' infrastructure and development processes, identifying SolarWinds as a valuable target with access to thousands of organizations.
-
Weaponization: The attackers developed a backdoor (SUNBURST) designed to hide in legitimate software, avoiding detection by antivirus and behavioral analysis.
-
Delivery: The attackers compromised SolarWinds' build infrastructure and inserted the backdoor into Orion updates. Customers received SUNBURST when they installed affected versions through the software update process.
-
Exploitation: The backdoor executed on servers running Orion, providing remote access.
-
Installation: The malicious component loaded as part of Orion and could run again when the service restarted. Clean Orion updates could replace the SUNBURST component, but attackers could retain access through separate persistence mechanisms established before the update.
-
C2: SUNBURST attempted to contact attacker-controlled infrastructure. The attackers selected a subset of exposed organizations for follow-on access and commands.
-
Actions on Objectives: The attackers used access to move laterally into victim networks, accessing government and corporate networks.
Diamond Model Analysis
- Adversary: FireEye initially tracked the activity as UNC2452. In April 2021, the US and UK governments publicly attributed the campaign to Russia's Foreign Intelligence Service (SVR), as documented in the UK government's attribution statement.
- Capability: SUNBURST (the supply-chain backdoor), along with custom tools for lateral movement and credential theft.
- Infrastructure: Legitimate SolarWinds infrastructure (the build servers), plus attacker-controlled C2 servers.
- Victims: Customers who downloaded affected Orion versions formed the potentially exposed population. Follow-on intrusions affected a smaller subset, including US government agencies and private companies.
The model highlights that the attacker leveraged victim trust in SolarWinds: customers believed the software was legitimate because it came from a trusted vendor.
ATT&CK Mapping
- T1195: Supply Chain Compromise (initial access, delivery)
- T1047: Windows Management Instrumentation (execution)
- T1543: Create or Modify System Process (persistence through service creation)
Incident Response Timeline
December 8, 2020: FireEye announces a breach of its own environment and the theft of tools used in security assessments.
December 13, 2020: FireEye publicly discloses SUNBURST and the compromised Orion updates. SolarWinds notifies customers and makes an initial hotfix available, as documented in its December 14 filing.
December 13, 2020: The Cybersecurity and Infrastructure Security Agency (CISA) issues Emergency Directive 21-01, ordering federal civilian executive branch agencies to disconnect affected Orion devices from their networks.
December 17, 2020: CISA releases advisory AA20-352A, describing compromises affecting government agencies, critical infrastructure, and private organizations. The advisory recounts the December 13 directive and provides investigation and mitigation guidance. It distinguishes delivery of the backdoor from follow-on activity in selected organizations.
January 2021: Organizations continue investigation and remediation, discovering the full scope of the attacker's lateral movement within their networks.
Key Lessons
-
Trusted updates can carry malicious code: SUNBURST reached customers through legitimate Orion updates. Trust in a vendor and a valid digital signature did not establish that the software was safe. Firewalls and intrusion detection systems could still help block malicious connections or detect known attack patterns.
-
Detection benefits from behavioral analysis and signatures: SUNBURST initially evaded detection. After discovery, FireEye published signatures and network detection rules. Defenders could combine those indicators with investigation of unusual connections and process activity.
-
Scope is difficult to determine: Months after discovery, organizations were still discovering systems compromised by the backdoor and determining the full extent of attacker access.
-
Coordination supports containment: SolarWinds, security firms, and government agencies shared affected-version information, indicators, and response guidance. Individual organizations used those findings to assess their exposure and contain identified compromises.
-
Recovery is long-term: Even after patches were applied, organizations had to hunt for evidence of lateral movement, assume attackers had stolen credentials, and rotate all credentials accessed during the window when SolarWinds was compromised.
Chapter Summary
-
Cyber Kill Chain models attacks as seven sequential phases: Reconnaissance, Weaponization, Delivery, Exploitation, Installation, Command and Control, Actions on Objectives. Each phase has observable indicators enabling detection and response decisions.
-
Diamond Model emphasizes relationships between Adversary, Capability, Infrastructure, and Victim. Understanding overlaps between these elements helps analysts attribute incidents and correlate separate incidents to single campaigns.
-
MITRE ATT&CK v19 organizes Enterprise techniques under 15 tactics, including Stealth and Defense Impairment. ATT&CK enables classification of observed behavior, link to known threat actors, and identification of defensive gaps.
-
Incident Response Process has seven phases: Preparation (establishing capabilities and procedures), Detection (identifying incidents), Analysis (understanding scope and impact), Containment (stopping attacker activity), Eradication (removing attacker presence), Recovery (restoring systems), and Post-Incident Activities (improving processes).
-
Detection Gap: Organizations typically detect compromises months after initial access. Early detection reduces damage and is critical for effective incident response.
-
SolarWinds case study demonstrates how compromised vendor updates can distribute malware, how behavioral analysis and signatures support detection, and how shared threat intelligence helps organizations coordinate their response.