CH13: Incident Response Techniques and Operational Efficiency
Introduction
Incident response at scale is not a series of discrete investigations conducted by heroic analysts working 24-hour shifts. Mature incident response is standardized, documented, and automated. A SOC that handles 100 incidents per month needs procedures that allow junior analysts to execute complex responses, tools that reduce manual work, and dashboards that provide real-time visibility into response progress.
This chapter covers the technical execution of incident response: how to perform triage and timeline reconstruction, how to acquire evidence while maintaining chain of custody, how to scope and execute containment without disrupting business, and how to eradicate attackers while minimizing the risk of re-compromise. It also covers the operational infrastructure that makes response efficient: playbooks and runbooks that document procedures, Security Orchestration, Automation, and Response (SOAR) platforms that automate repetitive tasks, and metrics that track progress and identify bottlenecks.
By the end of this chapter, you will understand the technical details of evidence acquisition, containment strategy, and the operational tools that enable efficient, standardized incident response.
Learning Objectives
Upon completing this chapter, students will be able to:
- Perform triage of incident indicators and establish timeline of compromise.
- Acquire evidence while maintaining chain of custody and data integrity.
- Scope incidents and determine isolation strategy based on risk and business impact.
- Execute containment, eradication, and recovery procedures safely and effectively.
- Implement SOAR, automation, and continuous monitoring to operationalize incident response.
13.1 Triage and Timeline Establishment
When an incident alert fires, the initial response is triage: rapidly determining whether the alert is genuine, what systems are affected, and what immediate actions are needed.
Alert Triage
Alert triage is the process of validating whether an alert represents a true positive (real attack) or false positive (benign activity misclassified as attack). A SOC generating thousands of alerts daily cannot investigate each one fully; triage allows rapid filtering.
Triage questions:
-
Is this a known false positive? Does the rule or detection trigger on legitimate activity that cannot be eliminated? (e.g., a backup system generating large file transfers that trigger "data exfiltration" alerts)
-
Is the source system known and trusted? Does the source IP or user account belong to known security testing, vulnerability scanning, or authorized administrative activity?
-
Is the target system critical or sensitive? Lateral movement within a development environment is lower-risk than lateral movement within a finance system.
-
Is the behavior consistent with the organization's baseline? A user logging in from their home IP address during normal business hours is lower-risk than an overnight login from a never-before-seen geography.
-
Are there corroborating indicators from other detection systems? If only one tool alerted but no other tool corroborates, it may be a false positive. If multiple tools (EDR, SIEM, network-based IDS) all indicate the same activity, confidence in the true positive is higher.
Triage should be rapid: a good analyst can validate or dismiss an alert in 5-15 minutes using historical baselines, threat intelligence, and context.
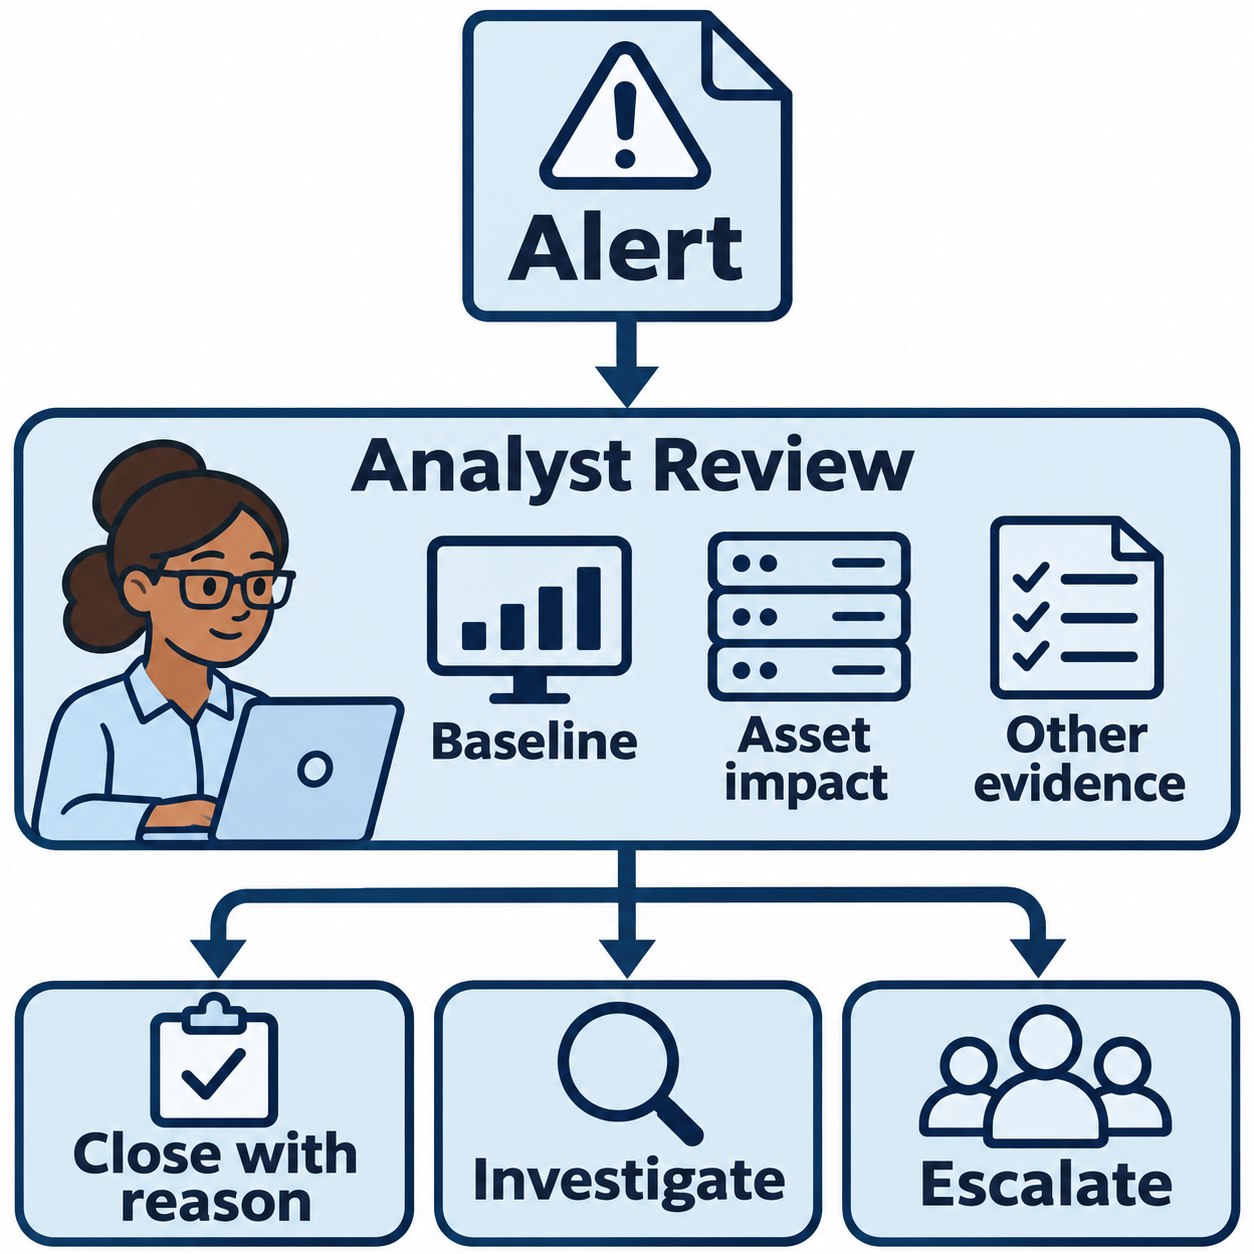
Figure 13.1: Triage combines context and evidence to choose the next response action.
Text description for Figure 13.1
An alert enters analyst review. The analyst checks the baseline, meaning the organization's usual activity, the importance of the affected asset, and evidence from other sources. The three possible outcomes are to close the alert with a documented reason, continue investigation, or escalate it. A familiar source or a lack of corroborating alerts does not by itself establish that activity is benign.
Timeline Reconstruction
Once triage confirms a true positive, the analyst begins reconstructing the timeline of compromise. This involves answering:
-
When did the attacker first access the system? Look for the earliest suspicious event: initial exploit, first malware execution, first unusual logon.
-
What systems were affected? Correlate alerts and logs to identify all compromised systems.
-
How did the attacker move laterally? Track process execution, logons, and network connections showing progression from initial access to other systems.
-
What was the attacker's objective? What actions were taken in the final phases (data collection, C2, destruction)?
Timeline reconstruction uses multiple data sources:
- EDR process execution logs: Show what processes ran and in what order, helping reconstruct attacker activities.
- Authentication logs: Windows Security Event ID 4625 (failed logon), 4624 (successful logon), 4768 (Kerberos TGT requests) show attacker logon activity.
- Web server logs: Timestamps show when specific HTTP requests were received, helping identify initial web-based exploits.
- Email logs: Phishing email timestamps help identify the delivery point and initial access timing.
- File system metadata: File access times, creation times, and modification times provide temporal markers.
Analyst Perspective
Timelines are often non-intuitive. System clocks may be out of sync, logs may be incomplete, and attackers deliberately manipulate timestamps to mislead investigation. Always cross-reference multiple data sources and be explicit about assumptions ("This timeline assumes the Windows Event Log's system clock is accurate within 5 minutes").
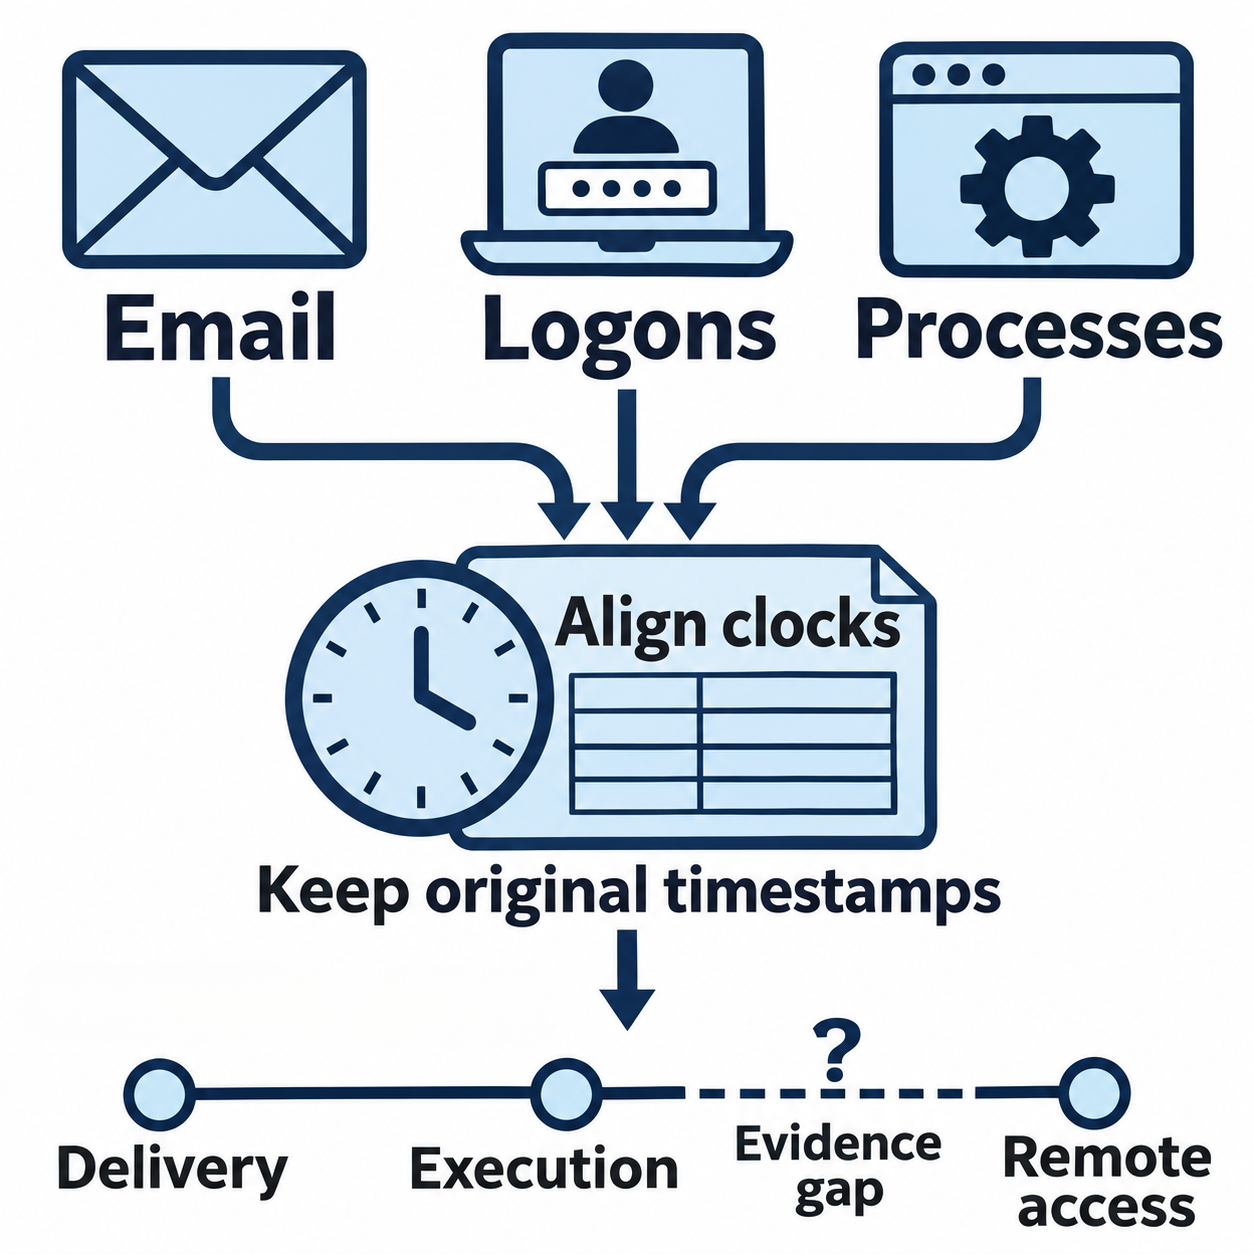
Figure 13.2: A reconstructed timeline aligns evidence while preserving uncertainty.
Text description for Figure 13.2
Email, authentication, and process records provide different views of activity. Align clocks means account for time zones and known clock differences in the analysis while retaining the original recorded timestamps. The illustrative sequence shows delivery, execution, an evidence gap, and remote access. The dashed segment and question mark identify missing evidence. This sequence represents a teaching example, not a universal attack order or a record of an actual incident.
Scope Determination
Scope is the set of systems affected by the incident. Determining scope accurately is critical because it determines:
- Containment strategy: How many systems need to be isolated?
- Recovery effort: How many systems need to be patched or rebuilt?
- Communication: How many users' credentials need to be reset?
Scope is determined by:
- Direct compromise indicators: Systems with malware, suspicious processes, unauthorized user accounts, or file modifications.
- Network connectivity: Systems that have been accessed by compromised systems (lateral movement targets).
- Credential access: Systems whose credentials were stolen by the attacker, even if the systems themselves have not been directly compromised. If a domain administrator password is stolen, all systems in Active Directory are at risk.
- Time-based analysis: All activity within the compromise window that could not be explained as legitimate is suspect.
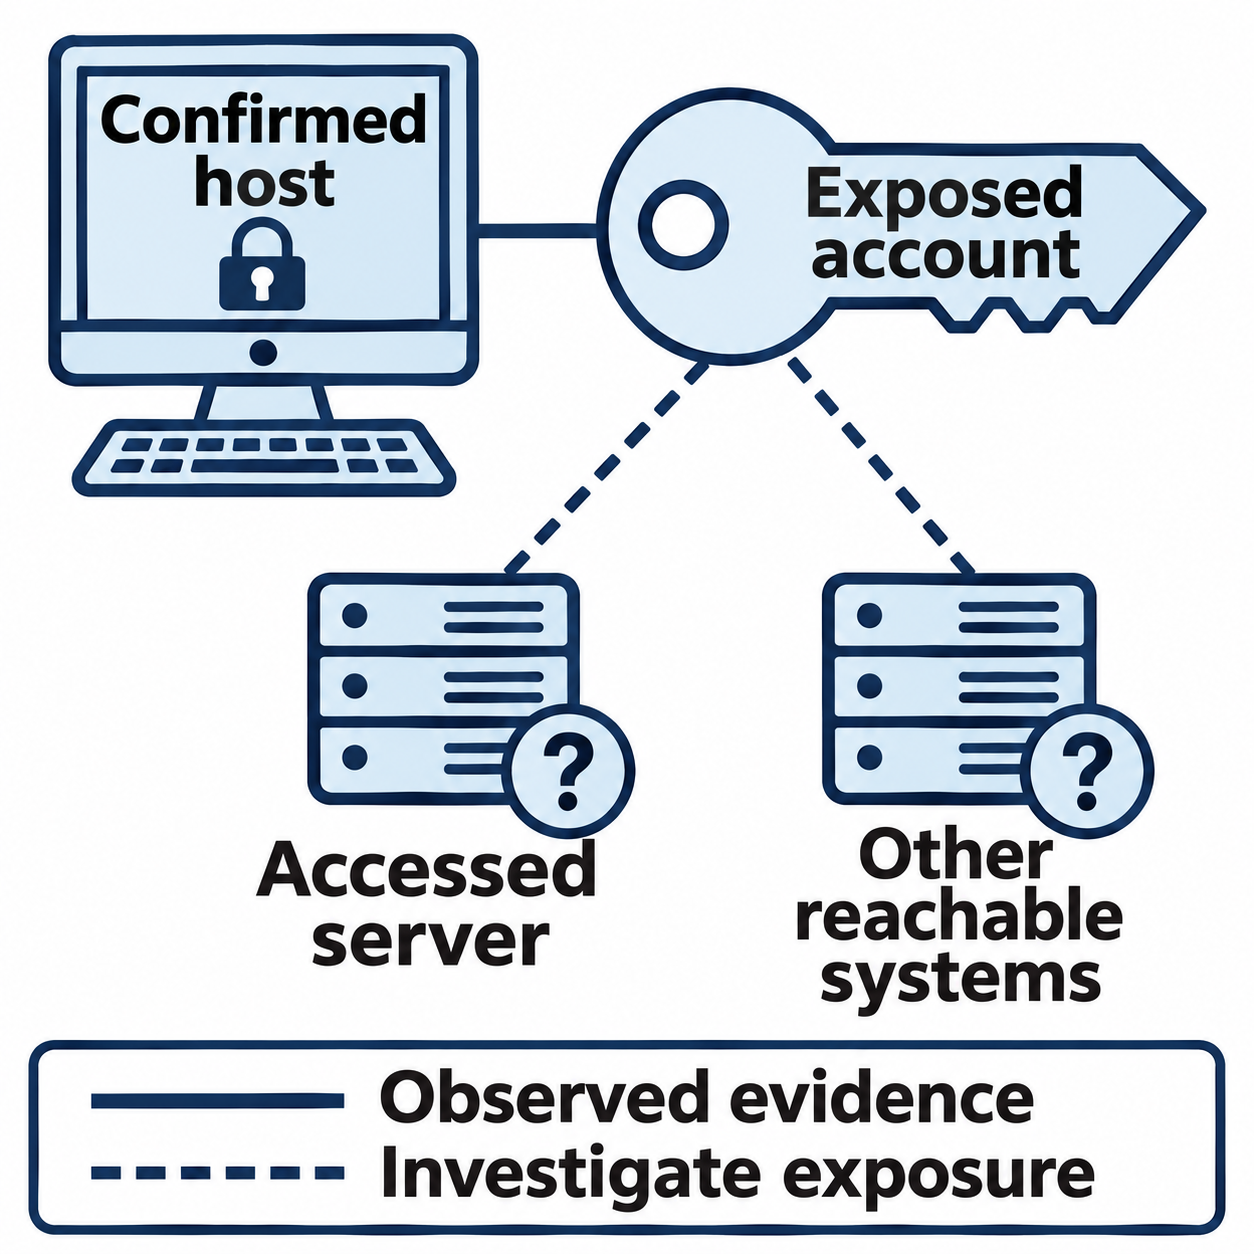
Figure 13.3: Scope assessment separates confirmed compromise from exposure that still needs investigation.
Text description for Figure 13.3
A solid connection links a host with confirmed compromise to an exposed account. Dashed connections lead to an accessed server and other systems the account could reach. Question marks show that those systems require investigation. The solid-line legend means observed evidence; the dashed-line legend means investigate exposure. An observed logon or an exposed credential can expand the investigation without proving that every reachable system is compromised.
13.2 Evidence Acquisition and Chain of Custody
Incident response often has two objectives: stopping the attack (tactical) and understanding what happened for legal/forensic purposes (strategic). This duality creates requirements for evidence handling.
Chain of Custody
Chain of custody is the documented record of evidence handling: who collected it, when, where it was stored, who accessed it, and in what condition. Maintaining chain of custody ensures evidence is admissible in legal proceedings and proves evidence has not been tampered with.
Chain of custody documentation includes:
- Item description: What is the evidence (hard drive, memory dump, log file)?
- Acquisition date/time: When was it collected?
- Acquisition method: How was it collected (forensic imaging, logical export, manual copy)?
- Collector: Who collected it?
- Hash values: MD5, SHA256 of the evidence to prove integrity.
- Storage location: Where is it physically stored?
- Access log: All individuals who handled the evidence, with timestamps.
For legal cases, violations of chain of custody can render evidence inadmissible.
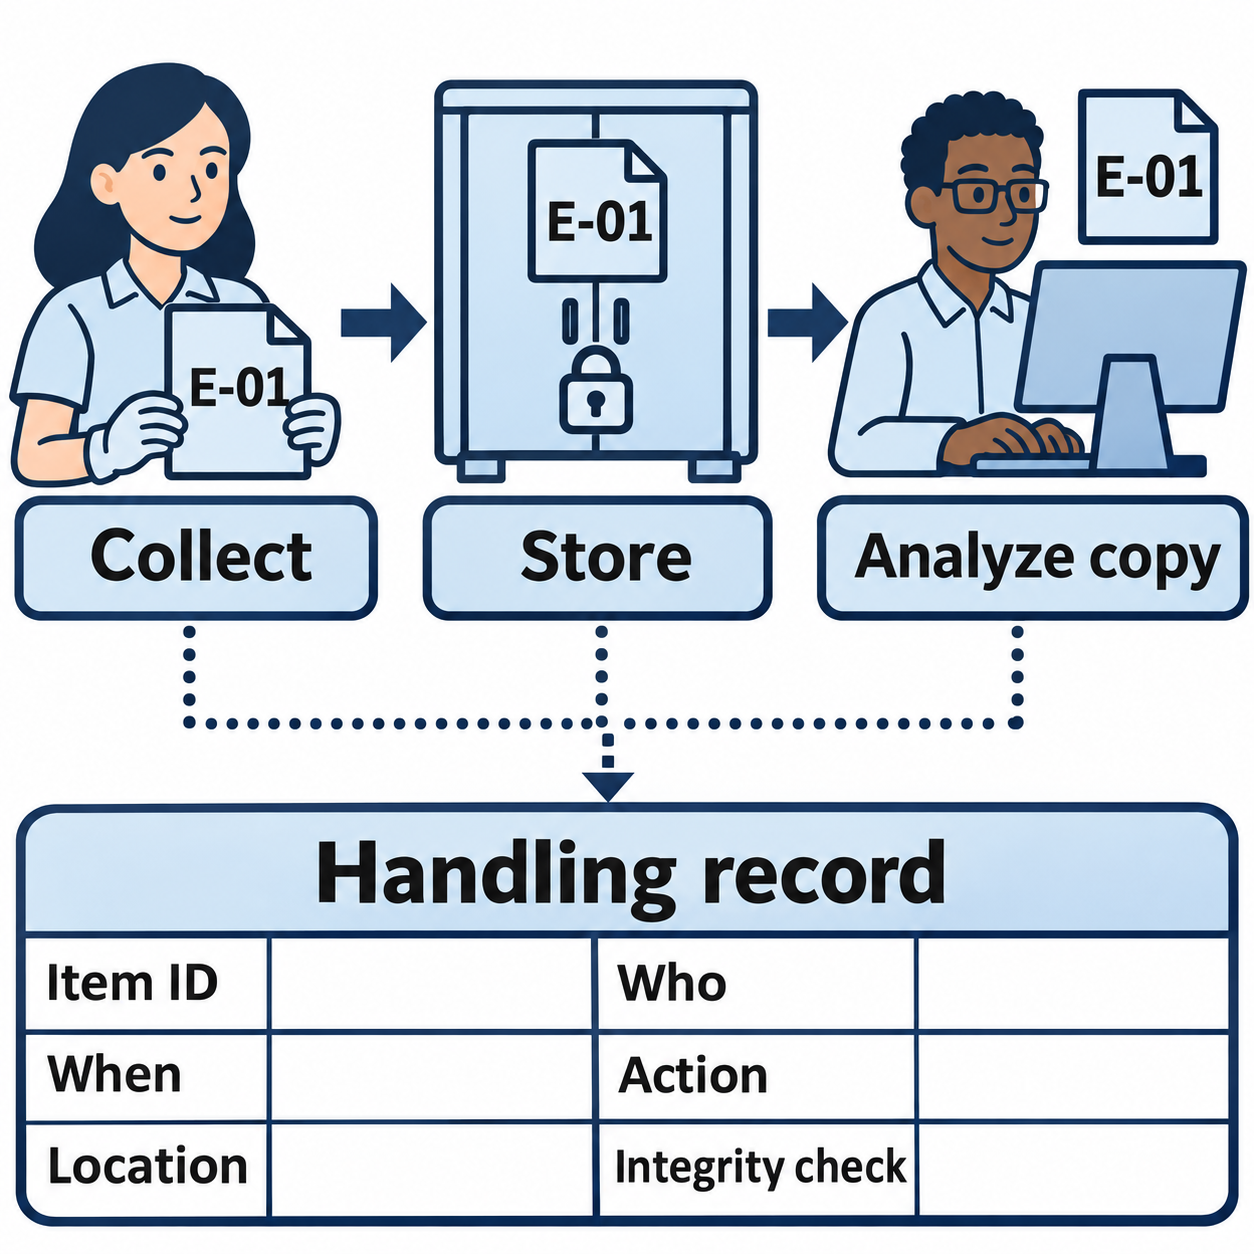
Figure 13.4: A custody record follows evidence through collection, storage, and analysis.
Text description for Figure 13.4
The same illustrative item identifier, E-01, follows evidence through collection, secure storage, and analysis of a working copy. Dotted connectors from all three stages lead to the handling record. Its fields identify the item, who handled it, when, the action, the location, and an integrity check. Document transfers and access as they occur. These records support traceability and integrity assessment; the diagram makes no guarantee about legal admissibility.
Data Integrity Validation
Data integrity validation proves that data has not been modified since collection. This is typically done through cryptographic hashing:
- Immediately after collection, compute a cryptographic hash (MD5, SHA256) of the evidence.
- Document this hash in the chain of custody record.
- Before any analysis, recompute the hash. If it matches, the evidence has not been modified. If it differs, the evidence has been tampered with.
Example:
# Collect a forensic image of a hard drive
dd if=/dev/sda of=/mnt/evidence/sda.img bs=4M status=progress

# Hash it immediately
sha256sum /mnt/evidence/sda.img > /mnt/evidence/sda.img.sha256
# Output: 4f8a9c2d1e3b5f7a6b8c9d0e1f2a3b4c5d6e7f8a9b0c1d2e3f4a5b6c7d8e9f /mnt/evidence/sda.img

# Before analysis, verify the hash
sha256sum -c /mnt/evidence/sda.img.sha256
# Output: sda.img: OK
If at any point the hash changes, evidence integrity is compromised.
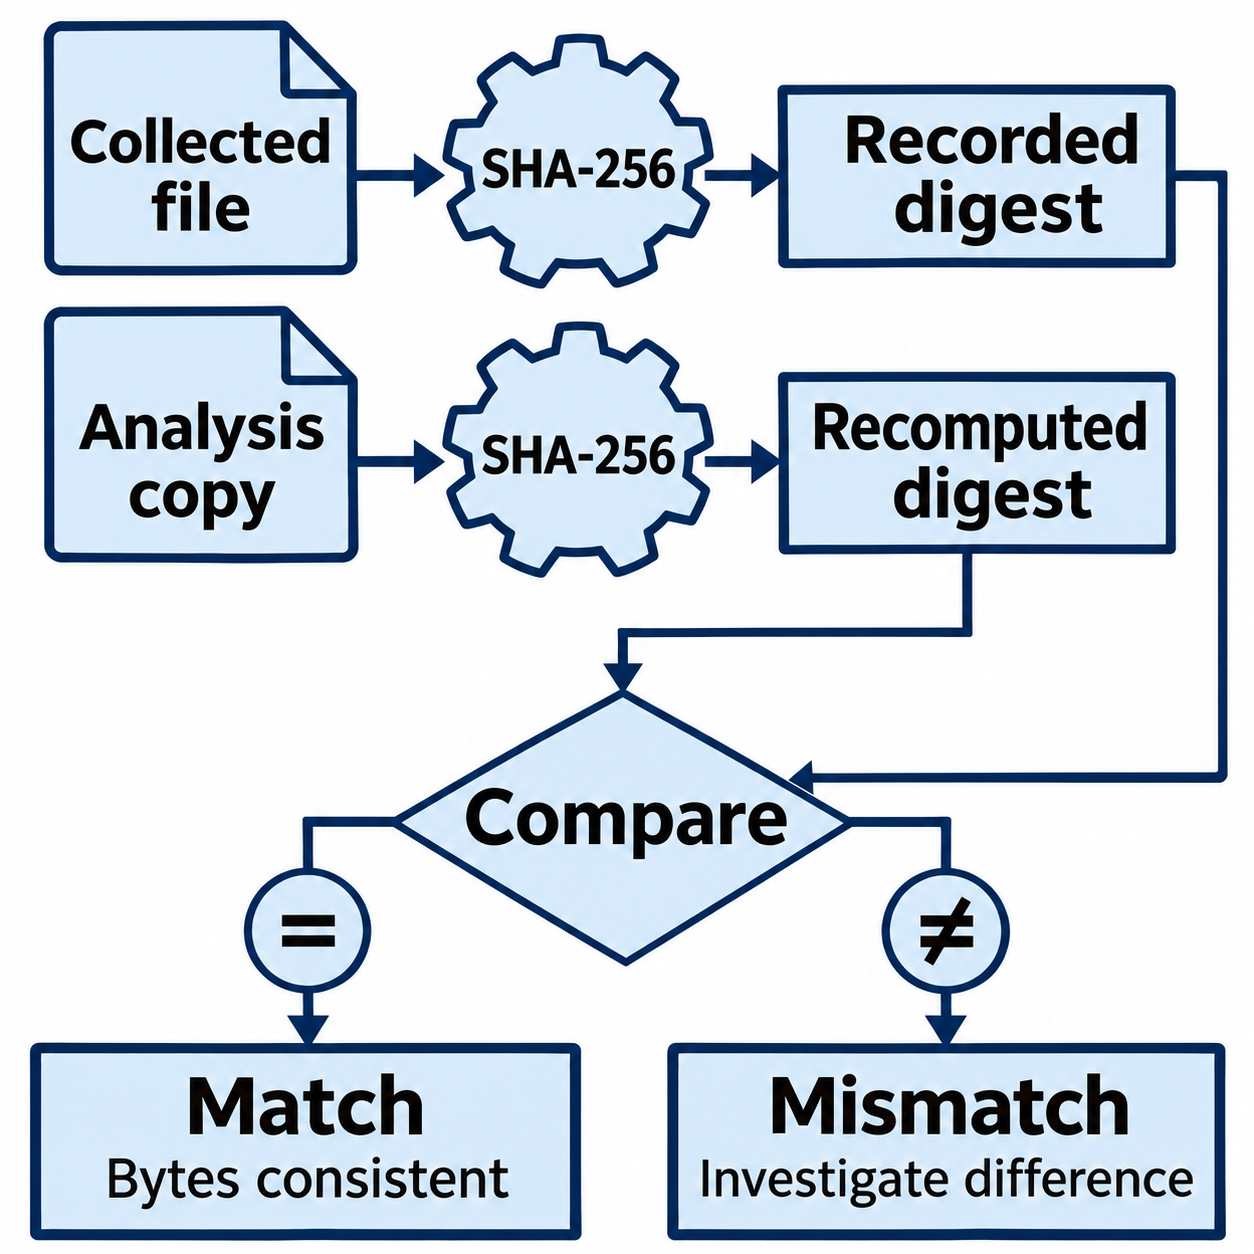
Figure 13.5: Hash verification compares a recorded digest with a newly computed digest.
Text description for Figure 13.5
Secure Hash Algorithm 256-bit (SHA-256) computes a digest, a fixed-length value derived from file contents. The upper path records a digest for the collected file. The lower path recomputes a digest for the analysis copy. Both digest outputs feed the comparison. Matching values support that the compared bytes are unchanged. A mismatch calls for investigation of possible modification, corruption, incomplete copying, or selection of the wrong file. It does not establish intent or prove tampering by itself.
Evidence Preservation
Evidence preservation ensures that volatile data is captured before it is lost. On a running system, volatile data includes:
- Memory (RAM): Contains running processes, encryption keys, and network connections. Lost when system is powered off.
- Temporary files: Caches, browser history, swap files that may be overwritten.
- Network connections: Open connections and current network state.
- Running processes: Process list, file handles, network sockets.
Modern incident response captures memory before powering off a system. Tools like Volatility, Lime, and WinPMEM acquire memory images.
Example memory acquisition (Linux):
# Acquire memory using Lime
insmod /path/to/lime.ko "path=/mnt/evidence/memory.lime format=lime"

# Verify integrity
sha256sum /mnt/evidence/memory.lime
Contrast this with traditional forensics, where a system is powered off immediately to preserve disk evidence. Modern incident response recognizes that memory contains critical evidence of running processes and network activity, requiring preservation before shutdown.
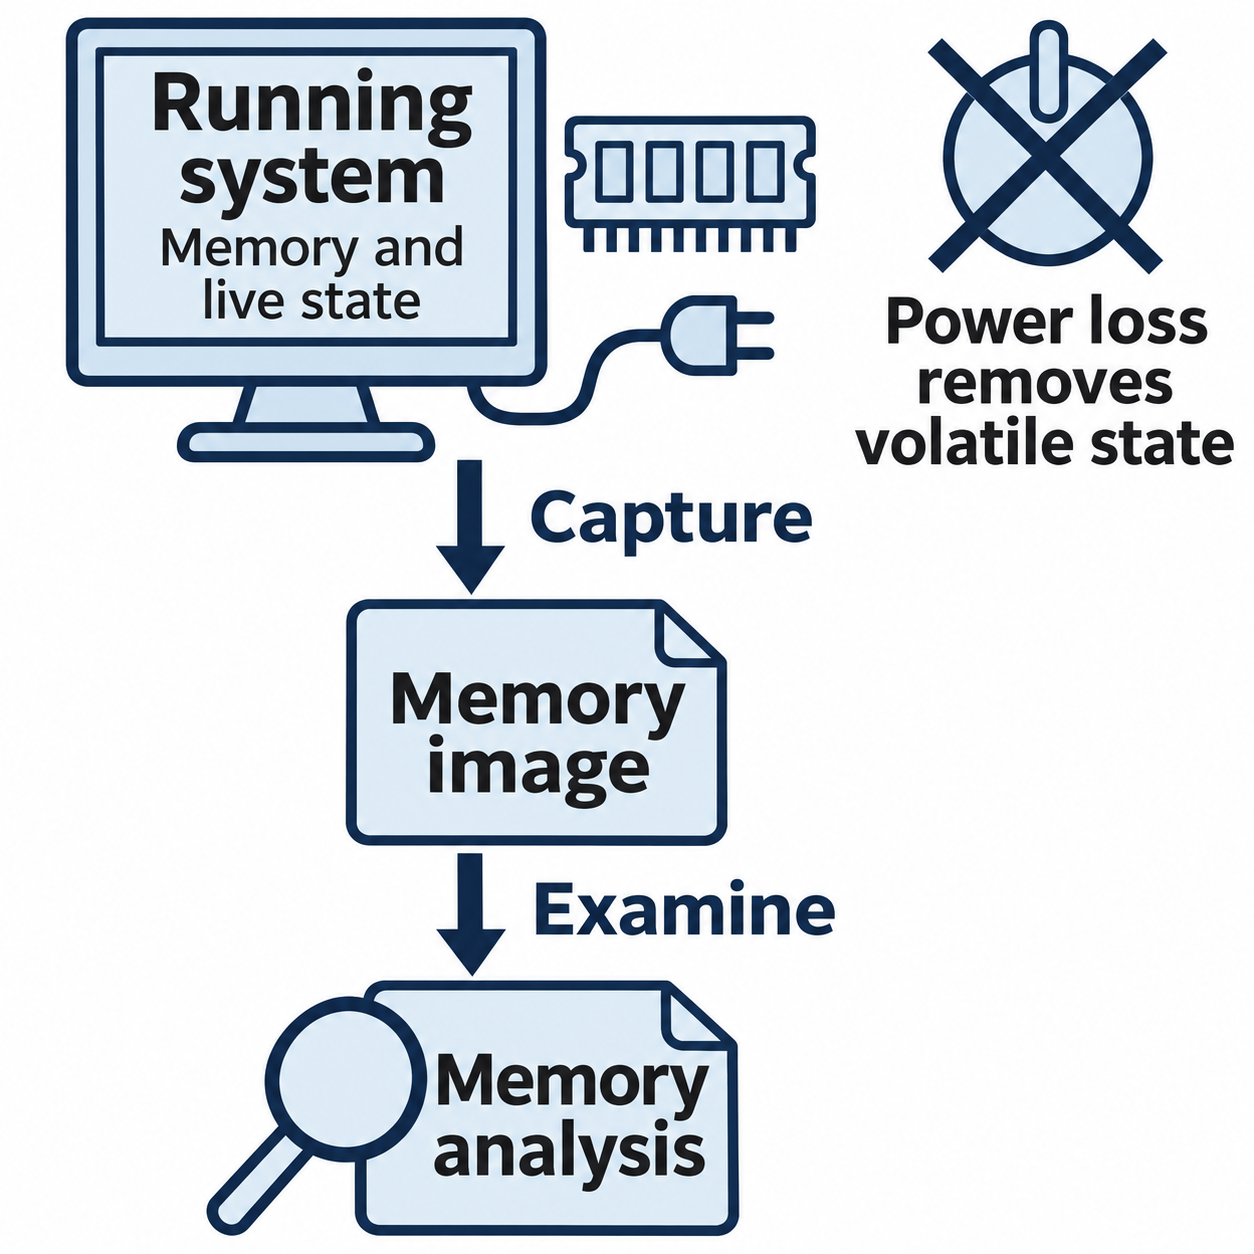
Figure 13.6: Memory acquisition preserves volatile state for a separate analysis step.
Text description for Figure 13.6
Volatile state is information that can disappear when a system loses power, including data in random-access memory (RAM). The diagram separates two actions: capture the running system's memory into an image file, then examine that file with a memory-analysis tool. Live acquisition changes some system state, so responders document the method and limitations. Collection priorities depend on safety, ongoing harm, and the incident response plan.
Logical vs. Forensic Acquisition
Logical acquisition exports files and logs at the operating system level, using standard tools (copy, tar, Windows zip utilities). This is fast and suitable for incident response, but it only captures allocated (in-use) files, not unallocated (deleted) files or disk slack.
Forensic acquisition images the entire disk at the block level, capturing allocated and unallocated data, file system metadata, and recovery information. This is time-consuming and resource-intensive but provides complete evidence for legal cases.
In incident response, speed is often prioritized: logical acquisition of critical logs and recent files provides sufficient evidence to confirm compromise and guide containment decisions. Full forensic imaging occurs post-containment if legal investigation is required.
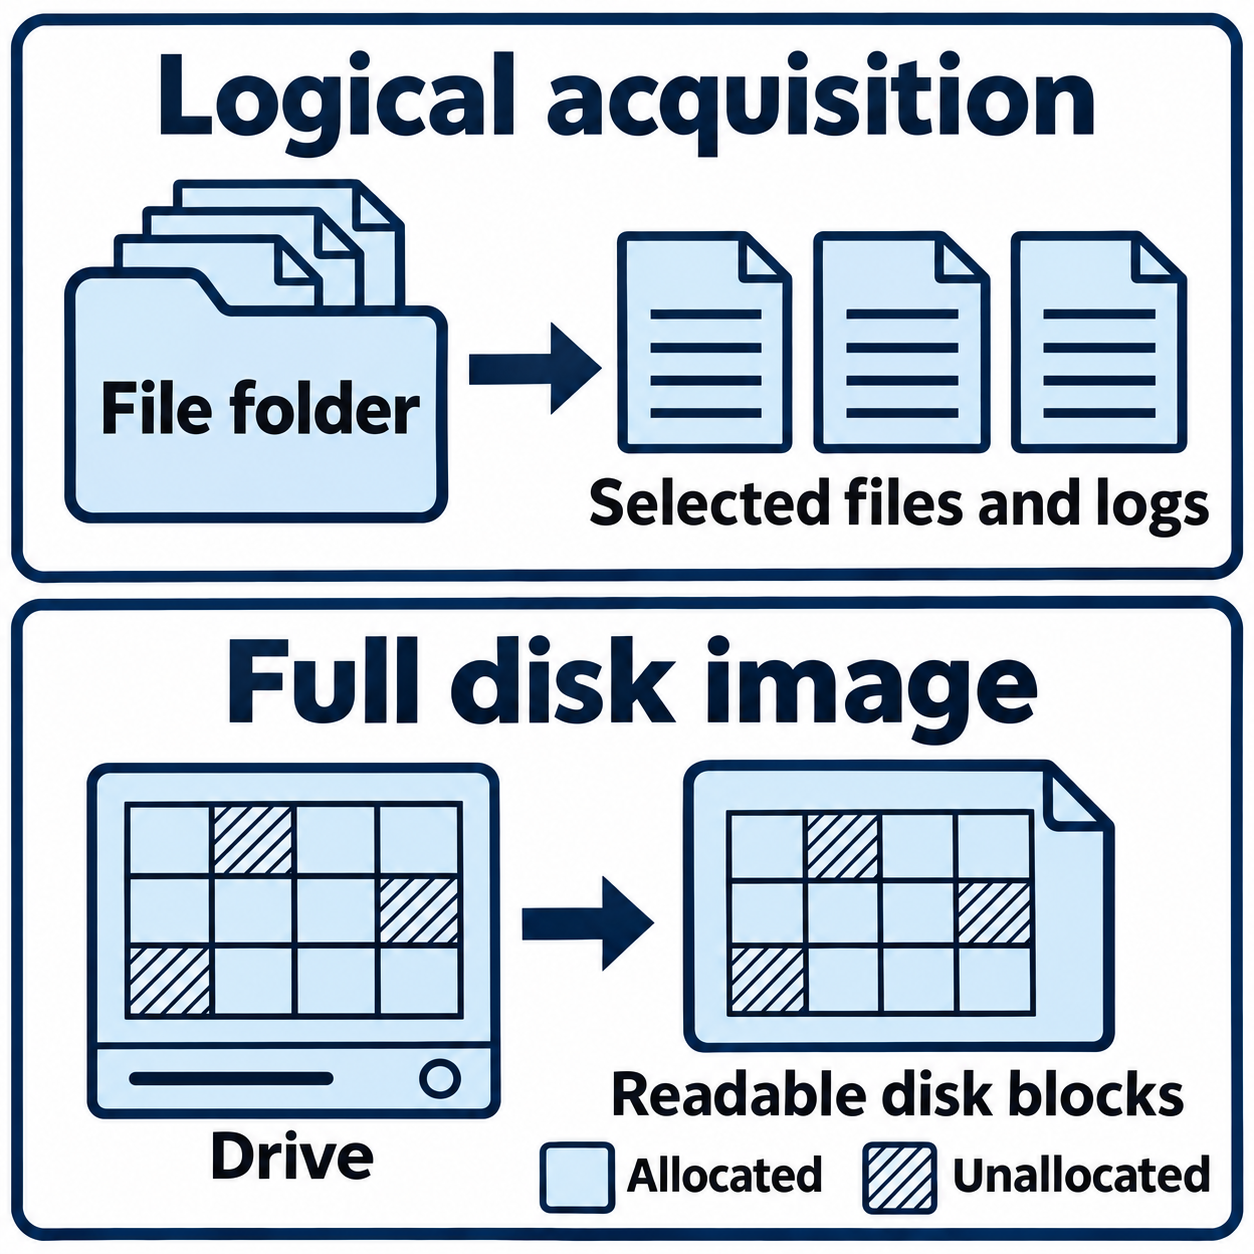
Figure 13.7: Logical acquisition selects accessible items; a full disk image captures readable blocks across the selected device.
Text description for Figure 13.7
The upper panel shows selected files and logs copied through file-level access. The lower panel shows the same twelve-block pattern in a source drive and its image. Plain cells represent allocated space, which the file system assigns to files. Hatched cells represent unallocated space, which it marks as available for reuse. The pattern is conceptual. Capturing unallocated space does not guarantee recovery of deleted content. Both acquisition approaches can support forensic work when their methods and limitations are documented.
13.3 Containment Strategy and Scope
Containment is the isolation of compromised systems to prevent lateral movement and further damage. Containment strategy depends on the incident's severity and scope.
Isolation Decisions
Full isolation (network disconnection) is the most aggressive containment. Compromised systems are disconnected from the network entirely, preventing any communication with attacker infrastructure or other internal systems.
Full isolation is appropriate for:
- Systems that are not critical to business operations
- Systems with confirmed active malware or C2 communication
- Servers housing sensitive data
Full isolation is inappropriate for:
- Critical systems where disconnection would cause business disruption (patient care systems in hospitals, manufacturing control systems)
- Systems without confirmed compromise where isolation would be excessive
Segmented containment (partial isolation) allows systems to remain partially operational while blocking attacker-controlled communication:
- Firewall rules block outbound connections to known malicious infrastructure
- Systems can communicate with business-critical systems but not with attacker-controlled systems
- Users can continue work with limited functionality
Segmented containment is appropriate for:
- Business-critical systems that cannot tolerate full shutdown
- Systems with suspected (but not confirmed) compromise requiring further investigation
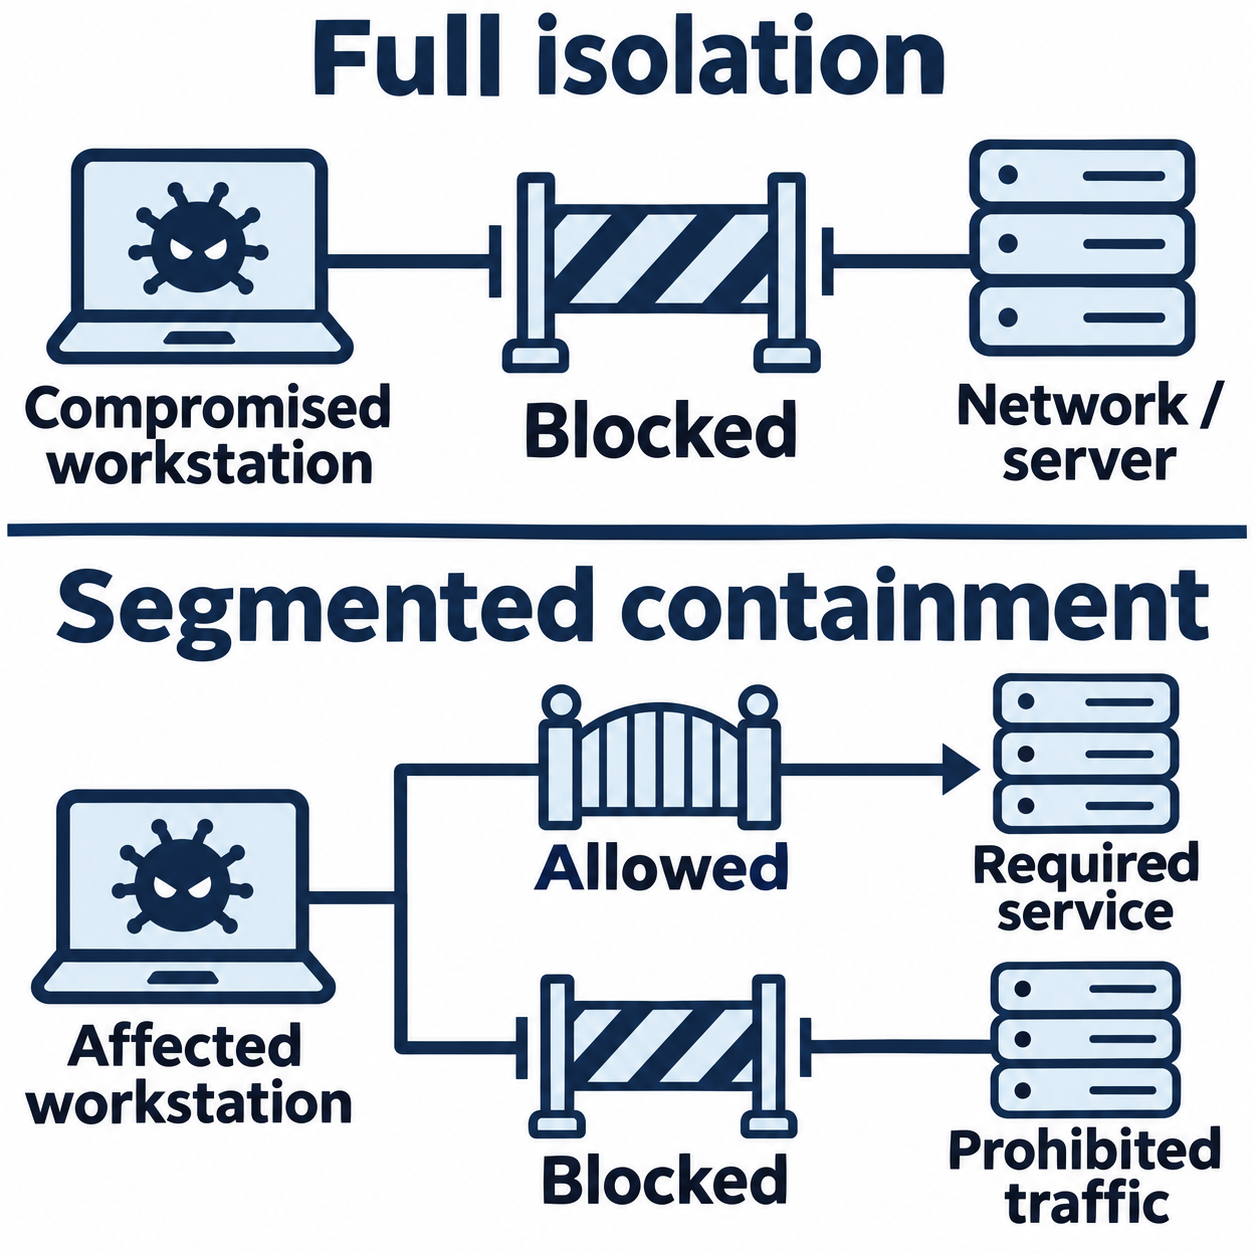
Figure 13.8: Containment changes which network paths remain available.
Text description for Figure 13.8
In the upper panel, a barrier interrupts communication between a compromised workstation and the network. In the lower panel, an affected workstation has two paths: an allowed path to a required service and a blocked path for prohibited traffic. Labels and barrier shapes distinguish the paths without relying on color. This is a conceptual comparison. The response team must test the actual controls and assess the remaining exposure and service impact.
Lateral Movement Prevention
Lateral movement prevention during containment stops an attacker from using compromised credentials to access other systems:
-
Credential reset: Reset passwords for all accounts that accessed compromised systems, forcing attackers to re-authenticate with new (unknown) credentials.
-
Endpoint isolation: Disconnect systems from the network before attackers can use stolen credentials to access other systems.
-
Network segmentation: Firewall rules isolate affected systems, preventing them from initiating connections to other segments.
-
Disable account: Disable user accounts that are compromised, preventing login with stolen credentials.
Containment Impact Assessment
Before containment, assess business impact:
- System criticality: How important is the system to business operations?
- Downtime tolerance: How long can the system be offline?
- Dependency mapping: What other systems depend on this system?
- Planned outage windows: Can containment be scheduled during maintenance windows?
A containment decision that isolates a critical system without considering its role in business operations can cause more damage than the original incident. Effective containment requires coordination between incident response and operations teams.
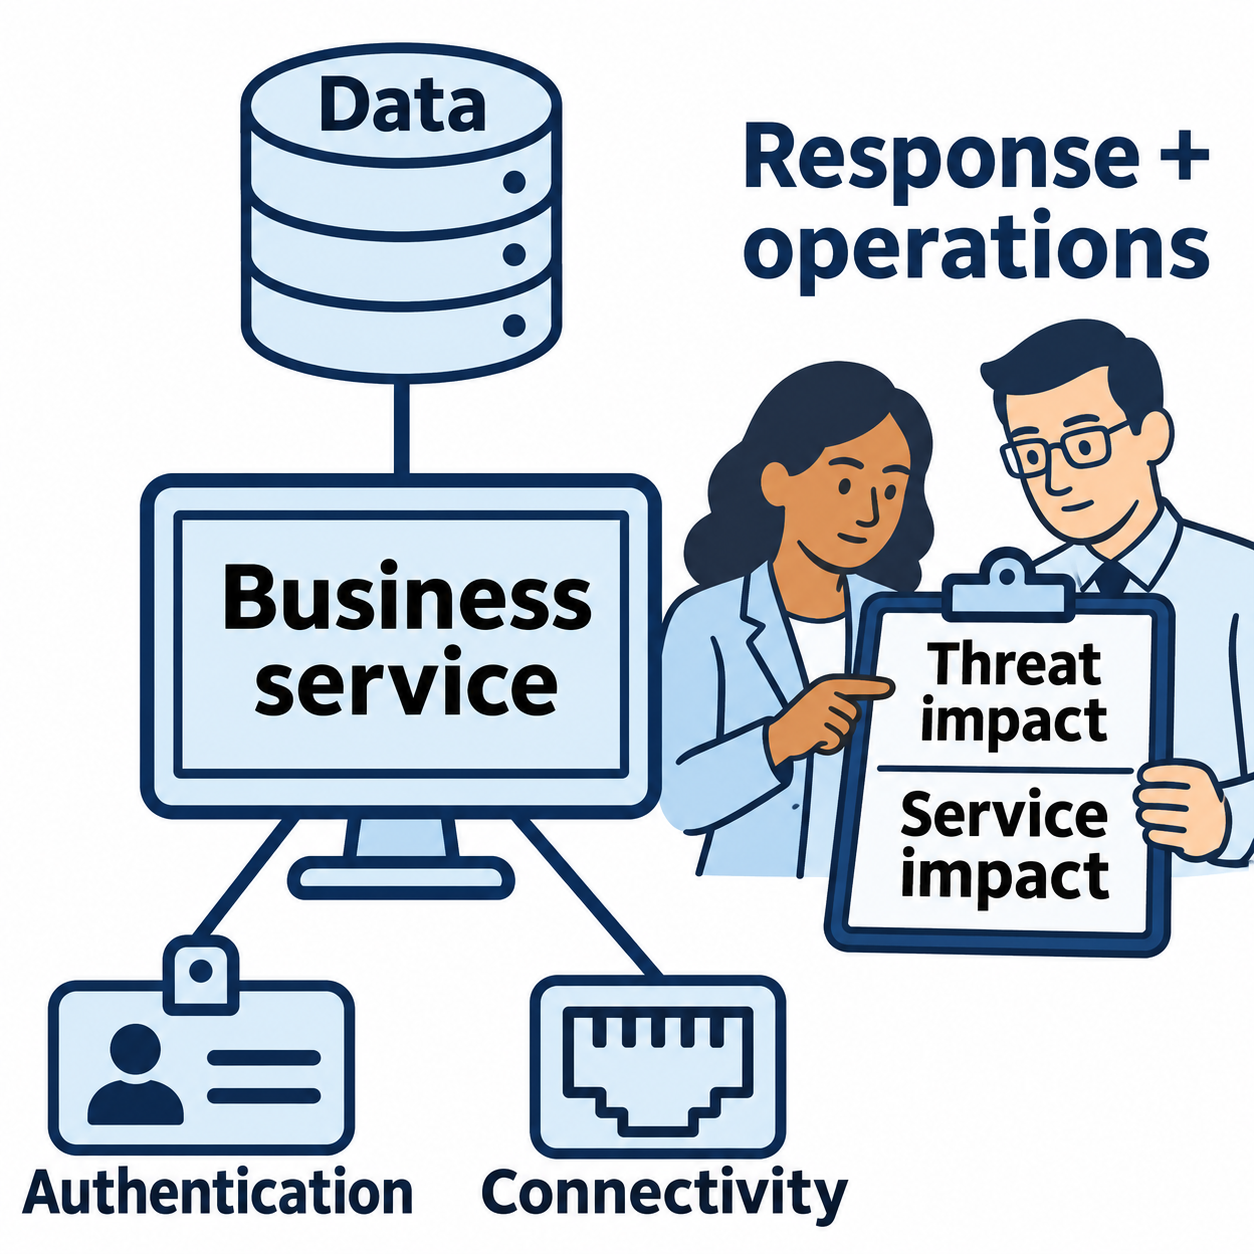
Figure 13.9: Dependency mapping helps response and operations teams assess containment impact.
Text description for Figure 13.9
The business service connects to three supporting functions: data, authentication, and connectivity. Authentication verifies a user's or system's identity. Disconnecting a supporting function may disrupt the service even when the service itself remains running. The response and operations teams review both the threat's impact and the effect of containment on service delivery. The map illustrates dependencies to examine, rather than prescribing one isolation choice for every incident.
13.4 Eradication and Recovery
Eradication removes the attacker's presence. Recovery restores systems to normal operations. Both must be executed carefully to avoid re-compromise.
Eradication Techniques
Malware removal involves identifying all attacker-installed tools and deleting them:
- Deleting executable files
- Removing scheduled tasks and registry entries
- Deleting web shells from web servers
- Uninstalling malicious services
Eradication is error-prone because:
- Malware may hide in alternate data streams (Windows) or extended attributes (Linux)
- Attackers use fileless malware (code in memory, registry, or .NET runtime) that leaves no files to delete
- Persistence mechanisms may be restored by recurring malware payloads
Clean rebuild is often safer than in-place eradication. Rebuilding involves:
- Isolating the compromised system
- Erasing the system completely
- Installing a clean operating system from trusted media
- Restoring data from clean backups (from before the compromise date)
- Restoring applications from clean installation media
- Patching vulnerabilities that enabled initial access
Clean rebuild is time-consuming but provides the highest confidence that all attacker tools and persistence mechanisms are removed.
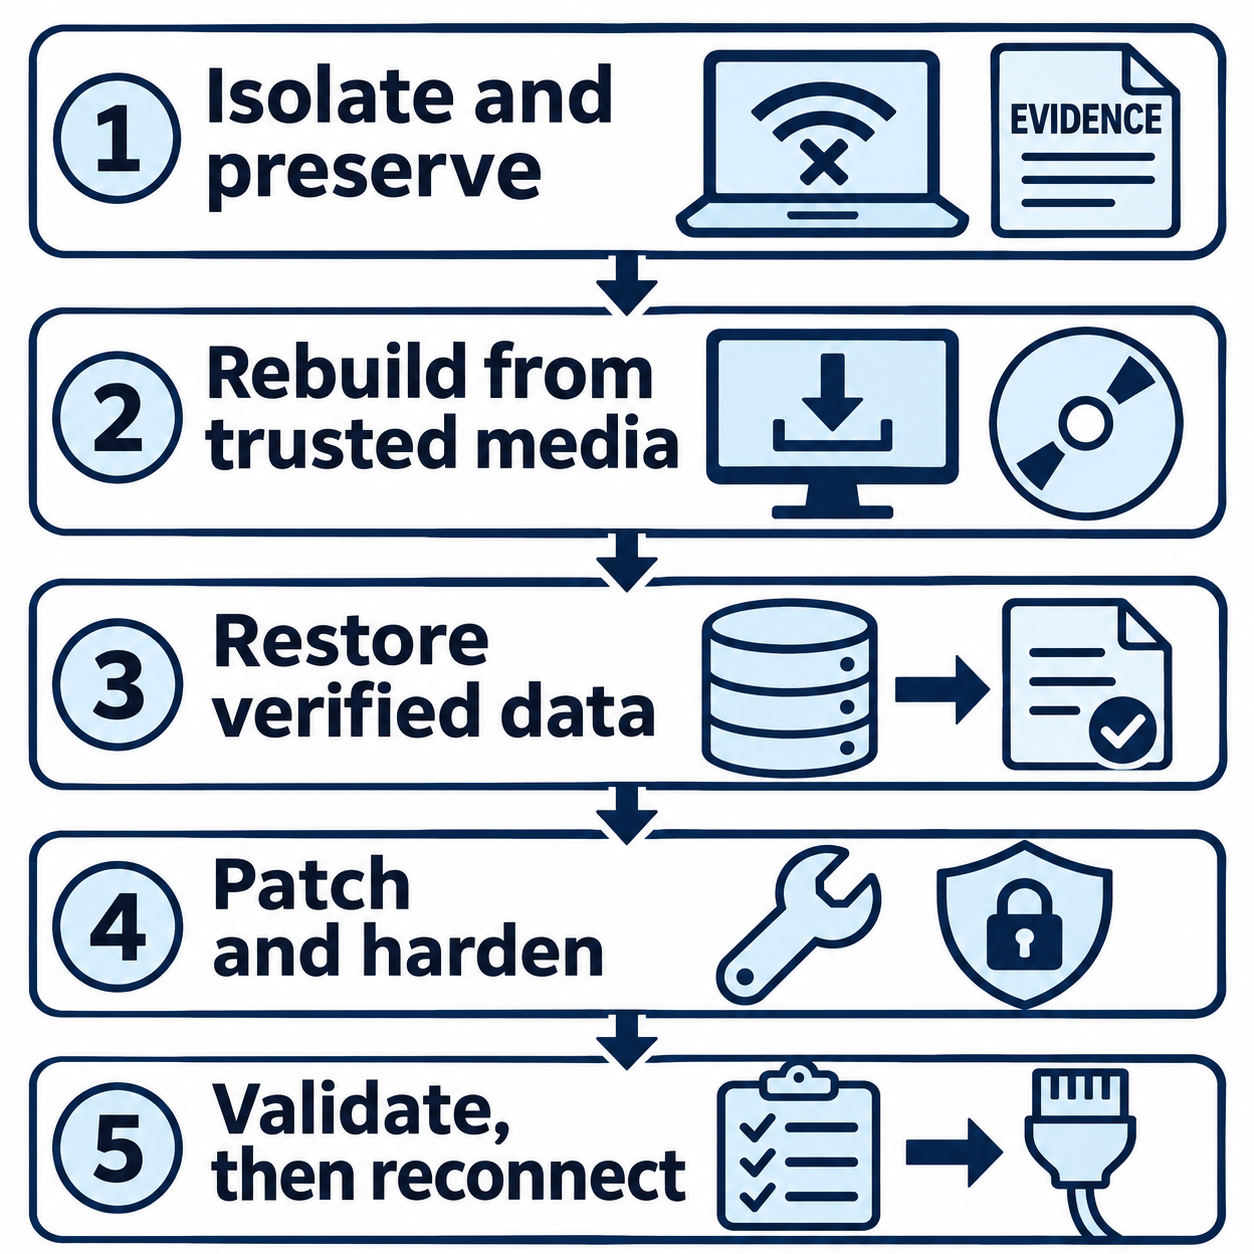
Figure 13.10: A rebuild workflow includes evidence preservation and validation before reconnection.
Open Figure 13.10 at full size
Text description for Figure 13.10
The numbered path is: 1. Isolate the affected system and preserve required evidence. 2. Rebuild the operating system and applications using trusted installation media. 3. Restore data checked for compromise from suitable backups. 4. Patch vulnerabilities and harden the system, meaning reduce unnecessary exposure and strengthen its configuration. 5. Validate security and business functionality before reconnecting. Some activities may overlap or repeat as findings change. Rebuilding one host does not resolve exposed credentials or compromise elsewhere.
Credential Rotation
Credential rotation invalidates credentials the attacker may have stolen:
-
Identify accessed accounts: From investigation, determine which accounts were compromised.
-
Reset credentials: Force password changes for all affected accounts. Attackers must then re-authenticate with new credentials.
-
Revoke tokens: Revoke API keys, OAuth tokens, and other authentication tokens issued to compromised accounts.
-
Review logon activity: Check authentication logs for all accounts the attacker accessed. If an attacker logged in with stolen credentials, credential rotation breaks that access.
Credential rotation is necessary even if the attacker is offline: if an attacker has written down stolen credentials, they can be used later.
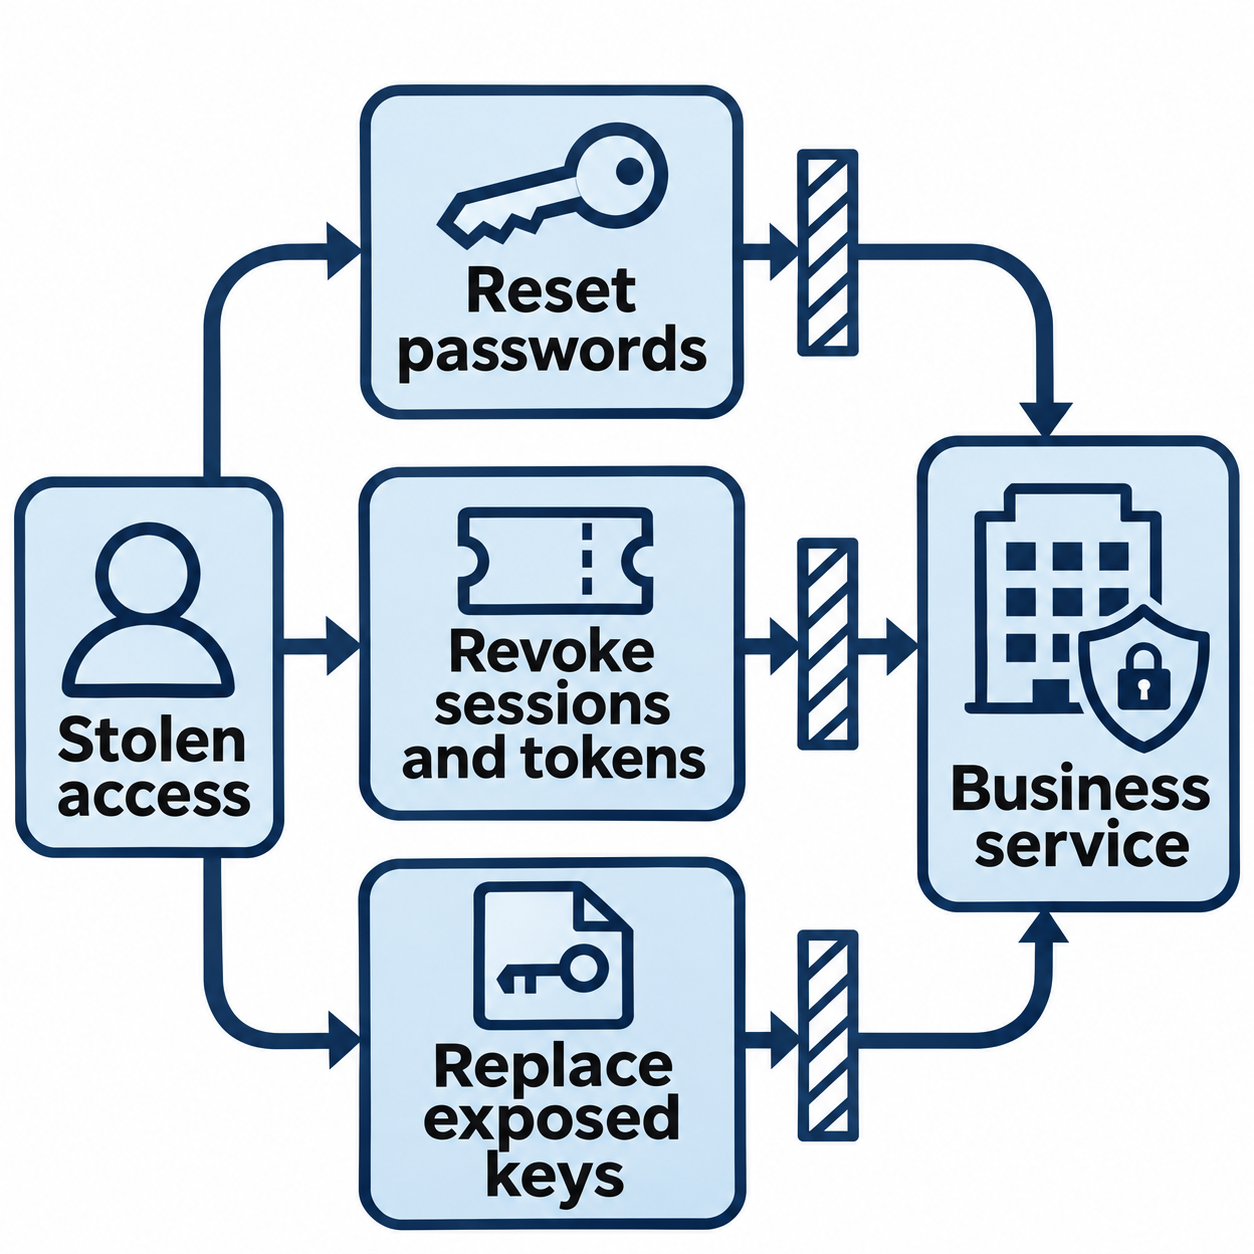
Figure 13.11: Credential recovery addresses each form of stolen access.
Open Figure 13.11 at full size
Text description for Figure 13.11
Stolen access can take several forms. The upper path represents passwords, which responders reset. The middle path represents sessions and tokens, which may continue to authorize access until the relevant service invalidates them. The lower path represents exposed keys, which responders revoke and replace. The separate gates show why a password change alone may leave other access material usable. Responders verify that each affected service rejects the old material and check subsequent logon activity.
Patch and Hardening
Patching addresses the vulnerability that enabled the compromise:
- Apply security updates that fix the vulnerability
- Verify the patch is installed correctly
- Test systems after patching to ensure functionality is not broken
- Monitor systems post-patch for indicators that the vulnerability is still exploitable
Hardening makes re-compromise more difficult:
- Reduce network-accessible services (disable unused ports, uninstall unused software)
- Increase logging and monitoring (enable audit logging, increase EDR telemetry)
- Strengthen authentication (enable multi-factor authentication)
- Segment networks (isolate critical systems from general user networks)
13.5 Continuous Monitoring and Hunt Operations
Incident response does not end with eradication and recovery. Continuous monitoring ensures the attacker does not return.
Persistence Detection
After eradication, the analyst establishes persistence monitoring: ongoing searches for signs the attacker has returned:
- Process execution anomalies (unexpected processes, unusual command-line arguments)
- Network outbound connections to known malicious infrastructure
- File system changes in critical directories
- Registry modifications
- New user account creation
- Authentication anomalies (logons from unusual locations, failed attempts)
These searches are codified as detection rules that run continuously against logs and telemetry.
Threat Hunting
Threat hunting is proactive, hypothesis-driven searching for attacker activity. Unlike detection (which reacts to alerts), hunting searches for activity that current detection rules miss.
Hunting hypotheses:
- "What if the attacker installed persistence that our detection rules did not catch?"
- "What if the attacker used a technique similar to APT28's known tools?"
- "What if there are other systems in the network with similar behavioral anomalies?"
Hunting uses data analytics and threat intelligence to develop plausible hypotheses, then searches logs and telemetry to validate them.
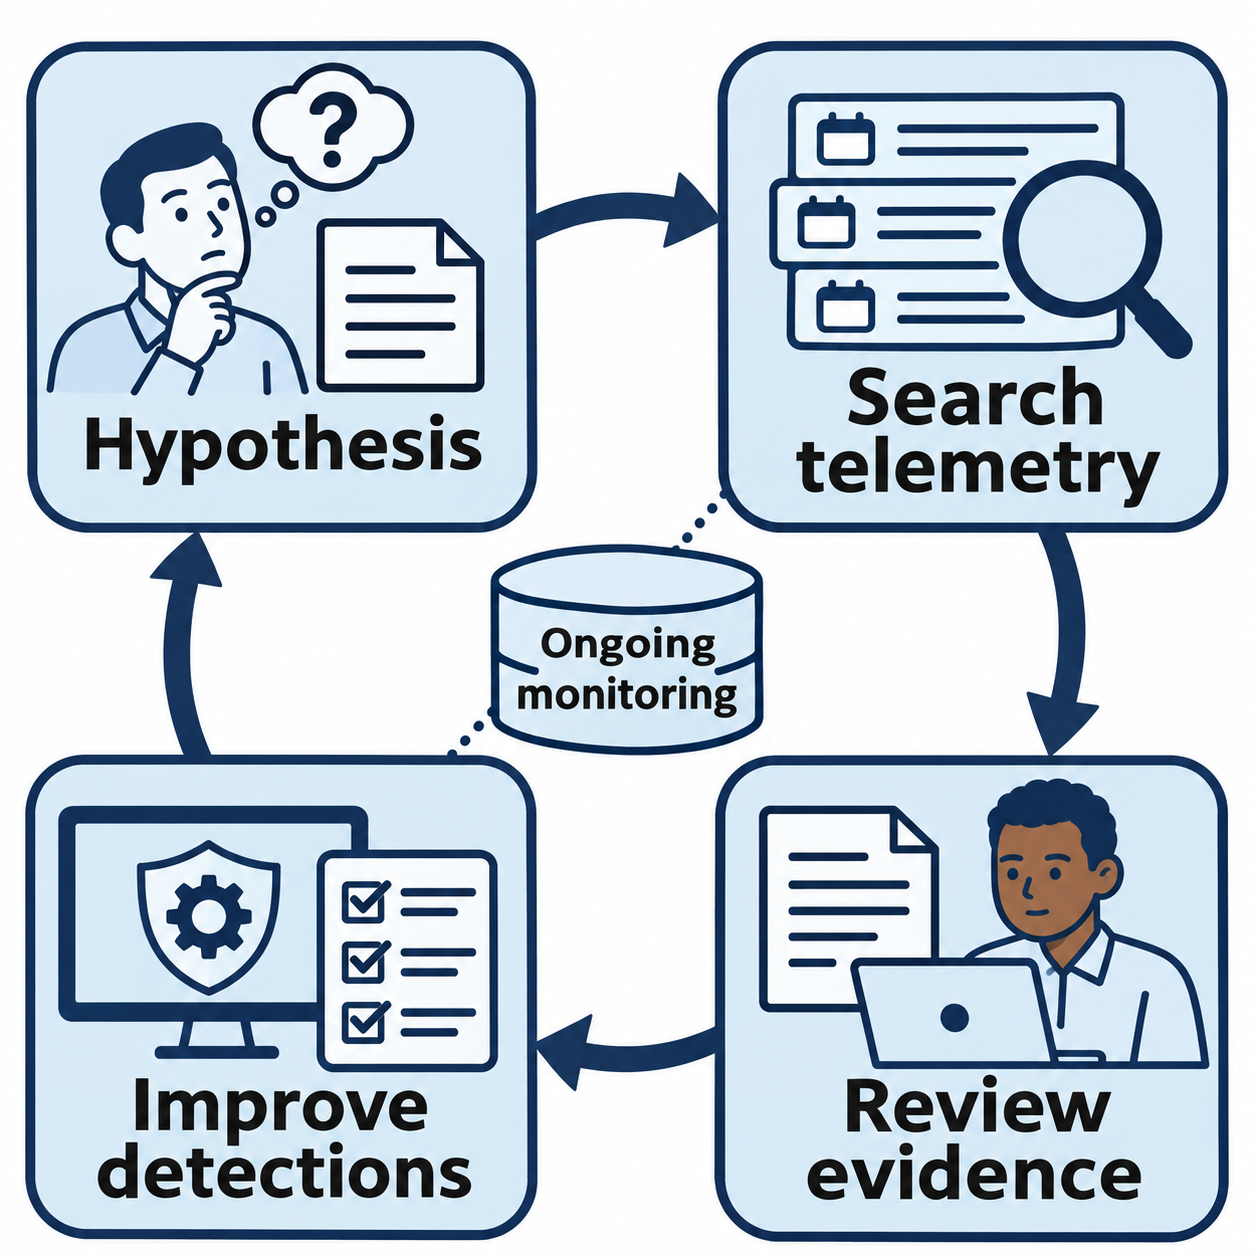
Figure 13.12: Threat hunting turns investigation findings into improved ongoing detection.
Open Figure 13.12 at full size
Text description for Figure 13.12
A hypothesis is a testable explanation, such as a suspicion that an attacker left a recurring task. The analyst searches telemetry, meaning event data collected from systems and tools, then reviews the evidence. Supported findings can improve detection rules and guide the next hypothesis. Ongoing monitoring supplies data and runs the improved detections. A hunt may also reject the hypothesis or reveal a collection gap; an empty search alone does not establish that the environment is clean.
13.6 SOAR and Automation
Security Orchestration, Automation, and Response (SOAR) platforms automate incident response workflows, reducing analyst toil and accelerating response.
SOAR Capabilities
Playbook automation executes multi-step response procedures automatically:
- Alert fires
- SOAR platform automatically queries threat intelligence for the alert's indicators
- SOAR checks if the indicator is known malicious
- If confirmed, SOAR automatically blocks the indicator at the firewall
- SOAR automatically isolates the affected system
- SOAR creates a ticket and notifies the incident response team
Playbooks are pre-written response procedures that encode institutional knowledge. A phishing playbook might:
- Extract sender, recipient, subject, and attachment hash from email
- Query threat intelligence for sender domain and attachment hash
- Search email logs for other emails from the same sender
- If email matches known phishing campaign, quarantine all matching emails
- Notify user not to click links
- Create incident ticket
Orchestration and APIs
SOAR orchestrates tools by connecting to their APIs:
- EDR API: Query process execution history, isolate endpoints, retrieve memory dumps
- SIEM API: Query logs, run correlation rules, retrieve artifacts
- Firewall API: Add/remove firewall rules, block IP addresses and domains
- Ticketing API: Create and update incidents
- Threat intelligence API: Query indicators against multiple platforms
Orchestration enables end-to-end automation where an alert in one tool triggers actions across many tools.
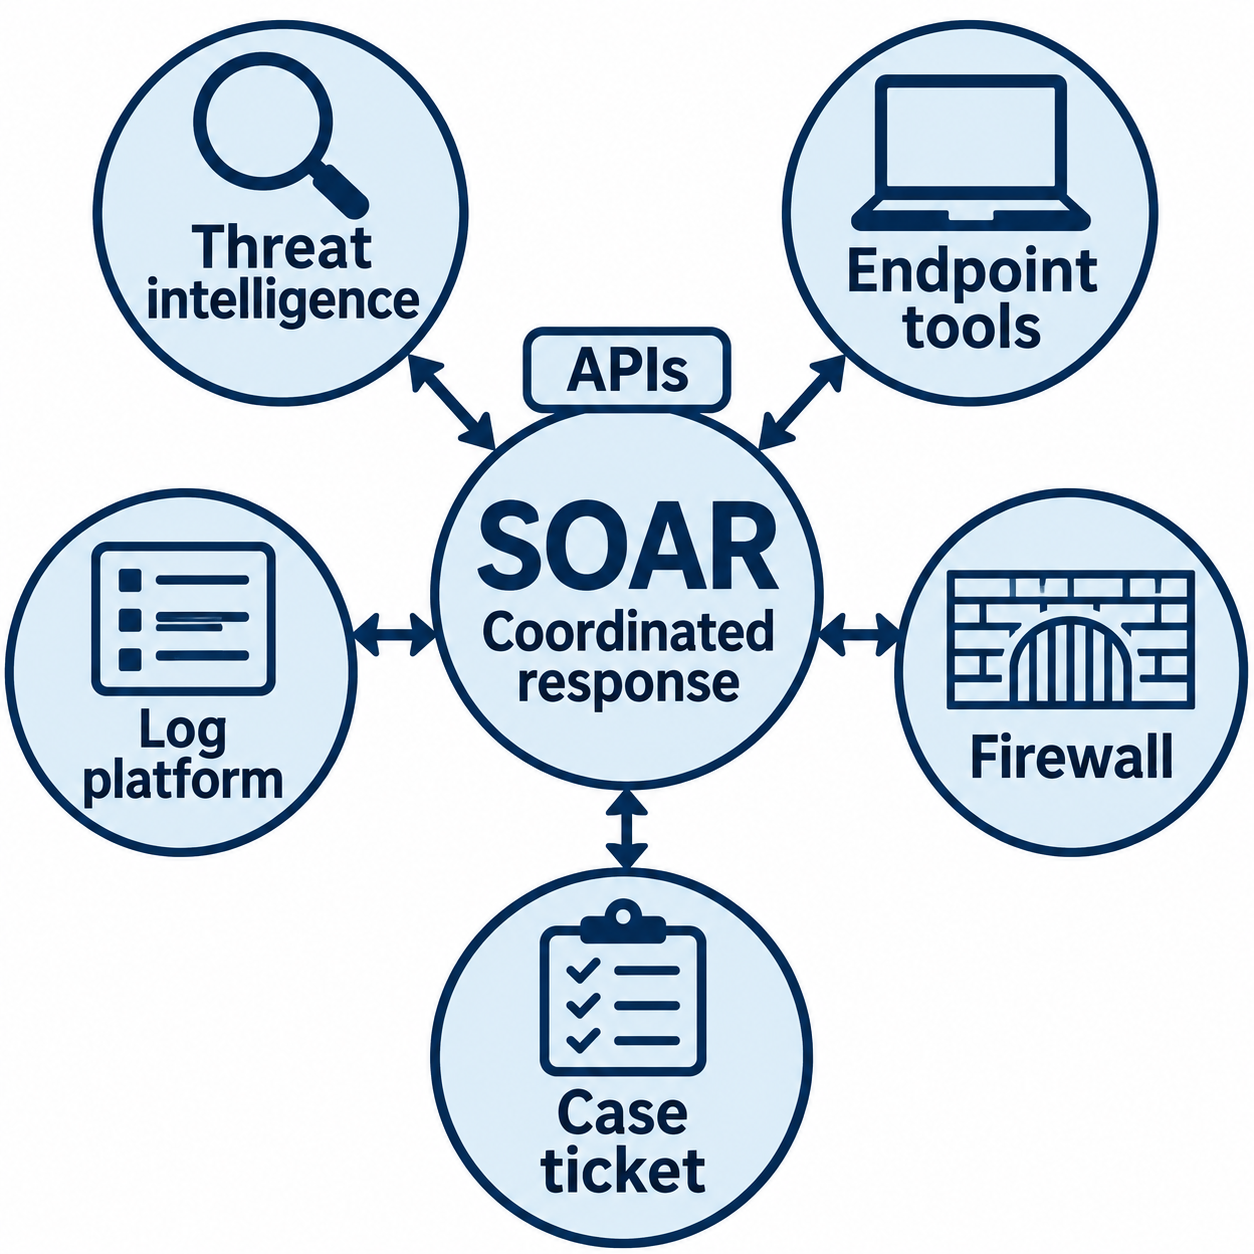
Figure 13.13: SOAR coordinates information and actions across connected response tools.
Open Figure 13.13 at full size
Text description for Figure 13.13
Security Orchestration, Automation, and Response (SOAR) coordinates workflows across tools. Application programming interfaces (APIs) let software exchange requests and results. The hub connects to threat intelligence, endpoint tools, a log platform, a firewall, and case ticketing. Two-way arrows represent requests and returned information or action status. Available actions depend on the connected product, its permissions, and the configured workflow. The diagram shows a conceptual integration, rather than a specific vendor interface.
Runbooks
Runbooks are step-by-step procedures for human execution of incident response. Runbooks document:
- Detection trigger (what alert indicates this incident type?)
- Triage steps (how to validate the alert?)
- Analysis steps (what data to collect?)
- Containment procedure (what systems to isolate?)
- Eradication steps (what to delete?)
- Recovery steps (how to restore?)
- Communication (who to notify?)
- Documentation (what to record?)
Runbooks enable junior analysts to execute complex procedures by following documented steps. This democratizes incident response: organizations are not dependent on senior analysts working heroic hours.
Example: Automated Phishing Response
Scenario: A phishing email with a malicious attachment reaches 50 employees. One employee clicks the link and downloads the file.
Without SOAR:
- Email gateway detects email (1 minute)
- SOC analyst is notified (5 minutes)
- Analyst retrieves email headers and attachment (10 minutes)
- Analyst uploads attachment to VirusTotal (2 minutes)
- Analyst reviews VirusTotal results (5 minutes)
- Analyst searches email logs for other recipients (10 minutes)
- Analyst checks if employee who clicked has installed malware (15 minutes)
- Analyst blocks sender domain (2 minutes)
- Analyst notifies email users not to click (5 minutes)
- Analyst creates incident ticket (5 minutes)
Total: 60 minutes. In that time, 50 employees have seen the email, and 1 employee has executed the malware.
With SOAR:
- Email gateway detects email (1 minute)
- SOAR automatically extracts sender domain, recipient list, and attachment hash (30 seconds)
- SOAR queries threat intelligence for sender domain and attachment hash (1 minute)
- If confirmed malicious, SOAR automatically:
- Quarantines the email (30 seconds)
- Blocks the sender domain at the firewall (30 seconds)
- Searches email logs for other emails from the same sender and quarantines them (2 minutes)
- Notifies all recipients via automated message not to click (1 minute)
- SOAR notifies SOC analyst and creates incident ticket (1 minute)
- Analyst reviews SOAR's actions and investigates the affected employee (10 minutes)
Total: 20 minutes. The containment is nearly automatic; the analyst focuses on investigation rather than mechanics.
Automation Risks
Automation speeds response but introduces risks. A buggy playbook could block legitimate traffic, isolate critical systems, or delete data incorrectly. SOAR systems require: - Careful design and testing of playbooks - Clear approval workflows (human review before destructive actions) - Rollback capabilities if automation causes unintended consequences - Monitoring of automation execution to detect failures
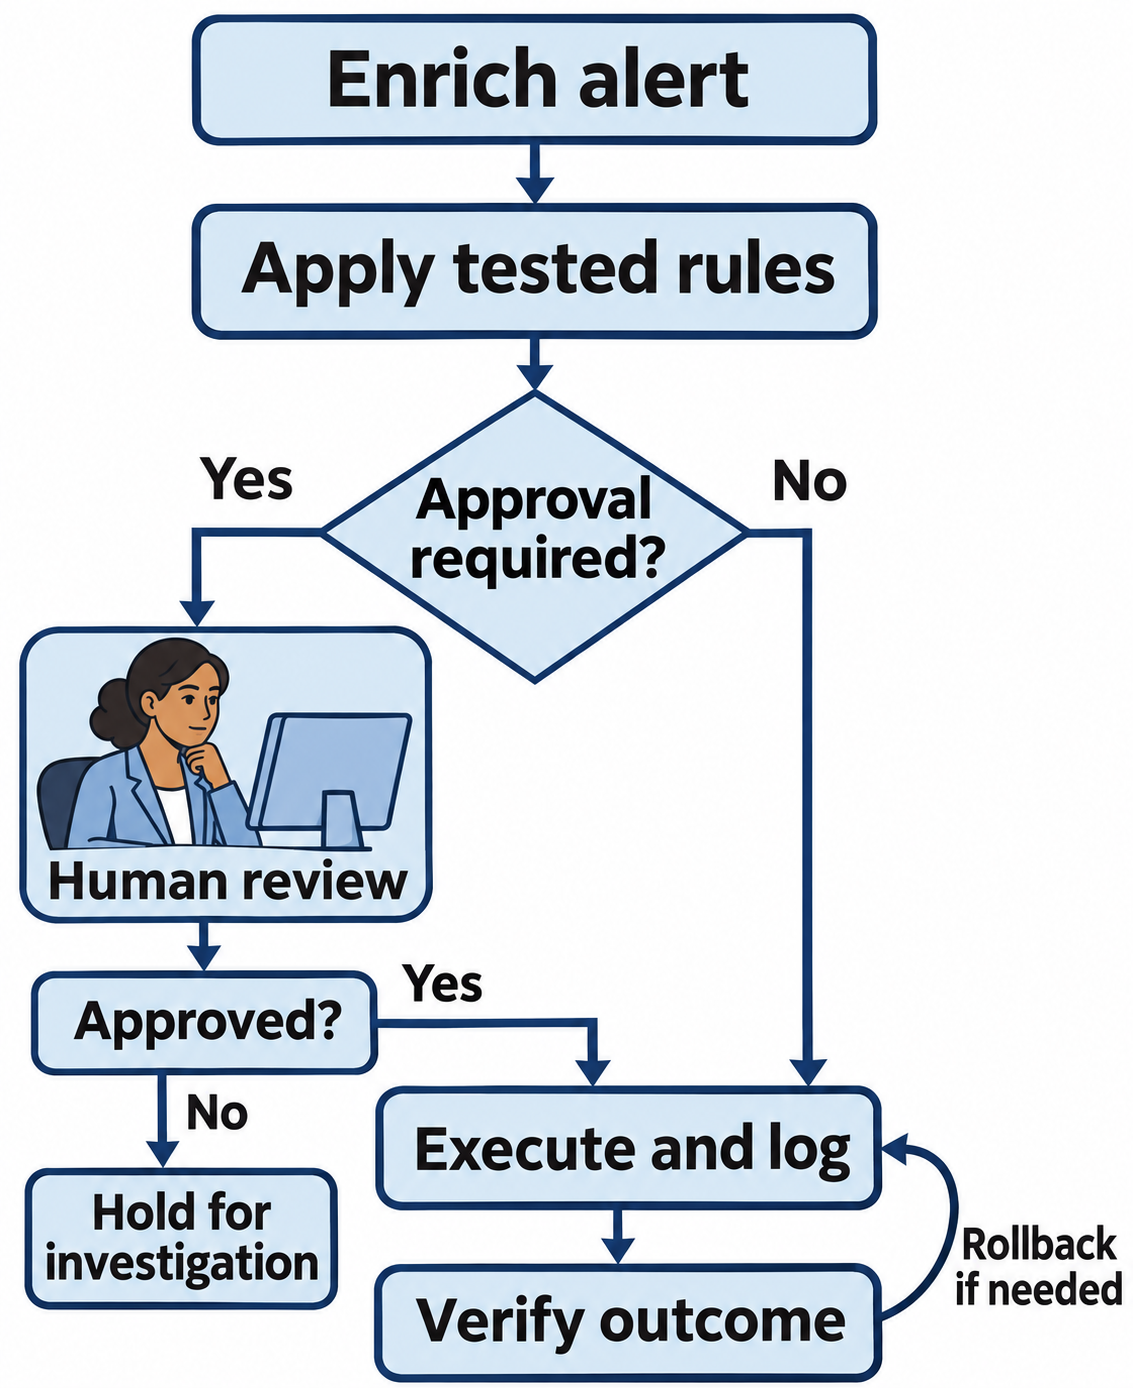
Figure 13.14: Automation follows tested rules, explicit approval requirements, and outcome verification.
Open Figure 13.14 at full size
Text description for Figure 13.14
The workflow first enriches the alert by adding context and applies tested rules. If policy requires approval, a human reviews the proposed action. Approval allows execution; rejection holds the case for investigation. An action already authorized for automatic execution follows the other branch. The workflow records execution and verifies the result. The rollback path represents undoing an action when supported and needed. Actions that cannot be reversed require suitable controls before execution.
13.7 Metrics and Operational Efficiency
Mature incident response programs track metrics that measure effectiveness and identify bottlenecks.
Key Metrics
| Metric | Definition | Target |
|---|---|---|
| MTTD (Mean Time to Detect) | Average time from attack initiation to detection | Hours to days |
| MTTC (Mean Time to Contain) | Average time from detection to containment | Minutes to hours |
| MTTR (Mean Time to Remediate) | Average time from detection to complete eradication and recovery | Days to weeks |
| MTTRemediate | Time from detection to completion of all remediation activities | Weeks |
| Alert fatigue / False positive rate | Percentage of alerts that are false positives | < 20% |
| True positive rate | Percentage of true incidents detected | High (complement of false negative rate) |
Organizations track these metrics over time:
- Decreasing MTTD indicates better detection capability
- Decreasing MTTC indicates faster response procedures and better automation
- Decreasing MTTR indicates more efficient eradication and recovery
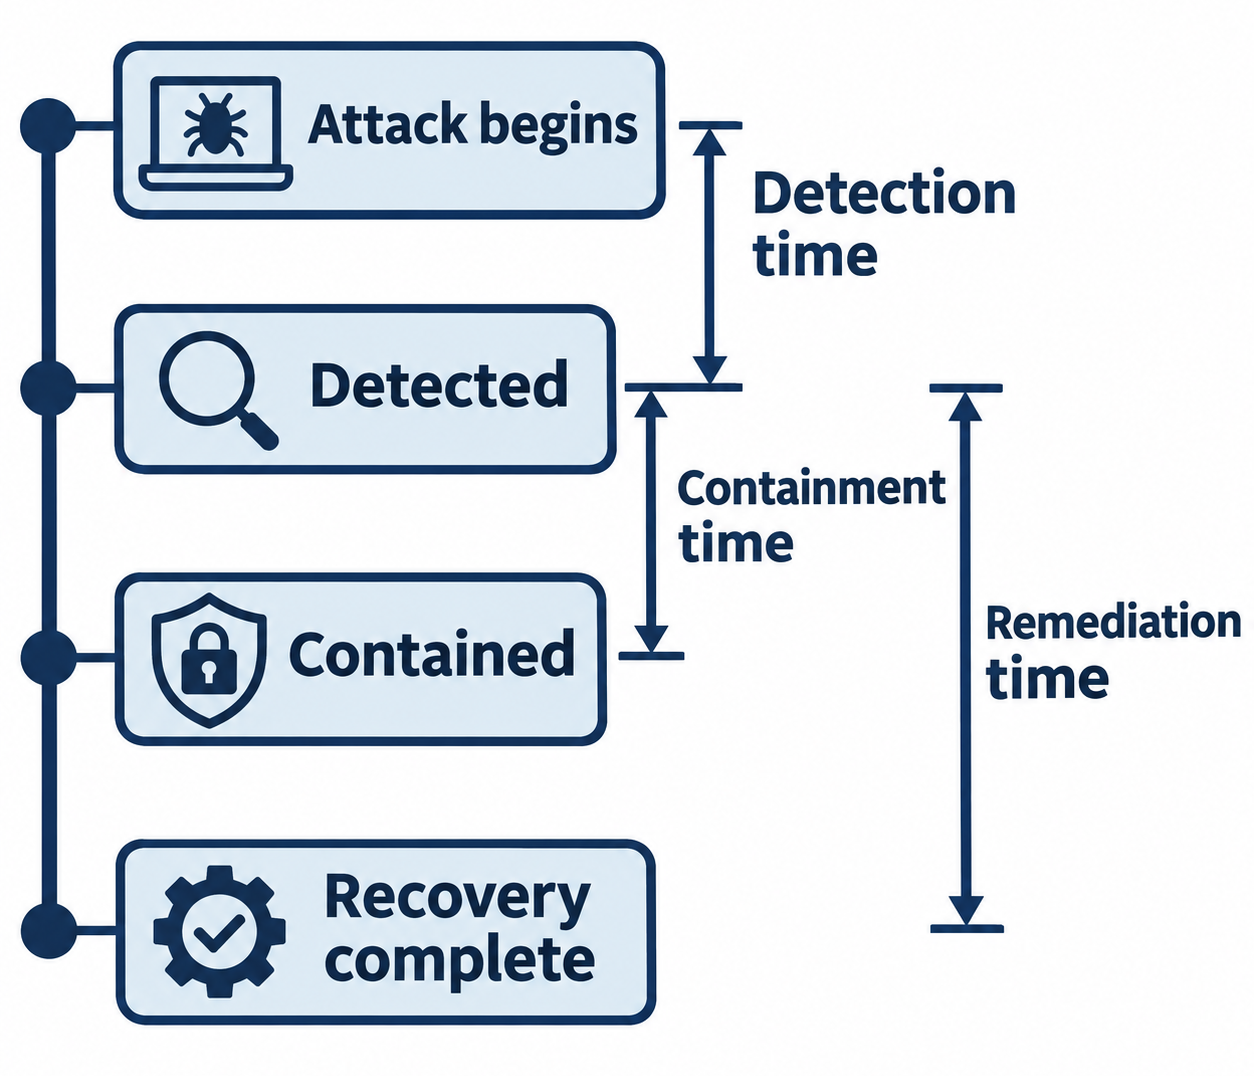
Figure 13.15: Response metrics depend on consistently defined starting and ending events.
Open Figure 13.15 at full size
Text description for Figure 13.15
Four milestones run down the timeline: attack begins, detected, contained, and recovery complete. Using this chapter's definitions, detection time spans the first two events, containment time spans detection to containment, and remediation time spans detection to recovery completion. Mean time is the average across a defined set of incidents. The drawing is not to scale and supplies no target durations. Organizations must define each milestone consistently and record uncertainty when the attack's actual start is unknown.
Operational Dashboards
Dashboards provide real-time visibility into incident response health:
- Alert volume by category: Trending of alert types
- Pending incidents by triage status: How many alerts are waiting to be triaged?
- Incidents by stage: How many are in detection, analysis, containment, eradication, recovery?
- SLA adherence: Are incident response SLAs being met? (e.g., 95% of alerts triaged within 4 hours)
- Metrics trends: Is MTTD improving or degrading?
Dashboards are reviewed regularly in incident response team meetings to identify process improvements.
13.8 Putting It Together: Change Healthcare Ransomware Incident
Incident: February 2024. Change Healthcare, a major healthcare payment processor, suffered a ransomware attack. The attacker compromised their infrastructure, encrypted critical data, and demanded ransom. The attack disrupted healthcare operations across the US, delaying insurance claims processing and patient billing for weeks.
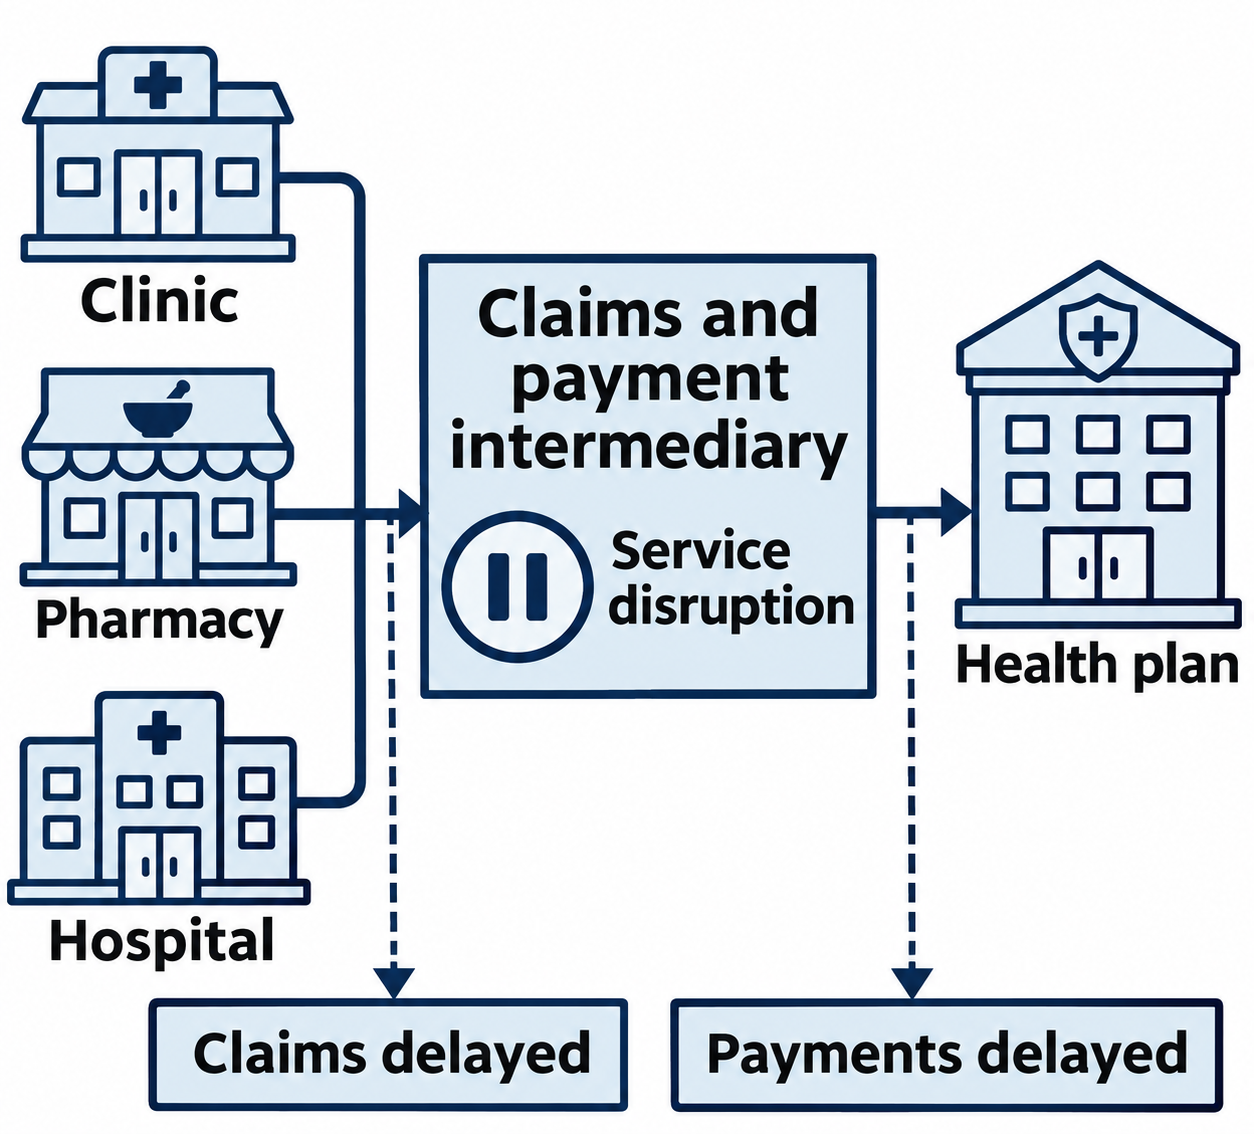
Figure 13.16: A shared payment intermediary can carry the operational effects of an outage across healthcare organizations.
Open Figure 13.16 at full size
Text description for Figure 13.16
Three provider types, a clinic, a pharmacy, and a hospital, depend on a shared claims and payment intermediary that connects to a health plan. A pause symbol marks disruption at the intermediary. Dotted impact arrows identify delayed claims and delayed payments. This conceptual dependency map illustrates the service impact discussed in the Change Healthcare case. It does not depict malware spreading to every connected provider or reconstruct the incident's chronology.
Timeline
February 21: Initial compromise. Attackers gain access to Change Healthcare's network through a vulnerability in a network device.
February 21-29: Lateral movement. Attackers move across the network, establishing persistence, stealing credentials, and accessing critical systems.
March 1: Encryption begins. Attackers execute ransomware, encrypting databases and file servers.
March 1: Detection. Operations team notices service outages and initiates incident response.
March 1-5: Initial analysis. Incident response team confirms ransomware, determines scope (significant portion of healthcare payment infrastructure), and begins containment.
March 5: Ransom demand. Attackers demand millions of dollars, threatening to publish stolen data.
March 5-15: Negotiation and decision. Change Healthcare and law enforcement discuss payment, ultimately deciding not to pay.
March 5-30: Recovery. Change Healthcare works with incident response vendors and internal teams to restore systems from backups, rebuild compromised systems, and verify all attacker access is removed.
March 30: Partial service restoration. Change Healthcare brings critical systems back online.
April-June: Extended recovery. Restoring full functionality takes weeks. Some healthcare organizations still experience disruptions.
Lessons Learned
-
Impact of supply chain: Change Healthcare is an intermediary that processes insurance claims, not a hospital or clinic. A single compromised intermediary disrupted healthcare operations nationwide.
-
Backup strategy: Recovery speed depends on having clean backups. Organizations without recent, tested backups face choices between paying ransom or accepting weeks of downtime.
-
Business continuity planning: Healthcare organizations relying on Change Healthcare had no contingency plan for service disruption, compounding the impact.
-
Scope determination: The initial scope was underestimated. Full scope became clear only after weeks of investigation.
-
Containment difficulty: Healthcare payment processing is complex, with many dependencies. Full isolation was not feasible without crippling healthcare operations. Containment required surgical, carefully-planned isolation of specific systems.
Chapter Summary
-
Triage rapidly validates whether alerts are true positives, using historical baselines, threat intelligence, and context. Timeline reconstruction establishes when the attacker accessed the network.
-
Chain of custody documents evidence handling to ensure admissibility in legal proceedings. Data integrity validation uses cryptographic hashing to prove evidence has not been modified.
-
Evidence acquisition captures both volatile data (memory) and persistent data (disk), using forensic tools to maintain integrity.
-
Containment strategy depends on incident severity and business impact. Full isolation is most secure but may be impractical for business-critical systems. Segmented containment balances security with operational continuity.
-
Eradication removes attacker tools. Clean rebuild is often safer than in-place eradication. Credential rotation invalidates stolen credentials.
-
SOAR automates routine response tasks, reducing analyst toil and accelerating response. Playbooks encode institutional knowledge, enabling consistent execution.
-
Metrics (MTTD, MTTC, MTTR) measure response effectiveness. Dashboards provide visibility into incident response health and identify improvement opportunities.
-
Change Healthcare incident demonstrates the impact of ransomware on critical infrastructure, the importance of backup and recovery strategies, and the complexity of containment in interconnected systems.